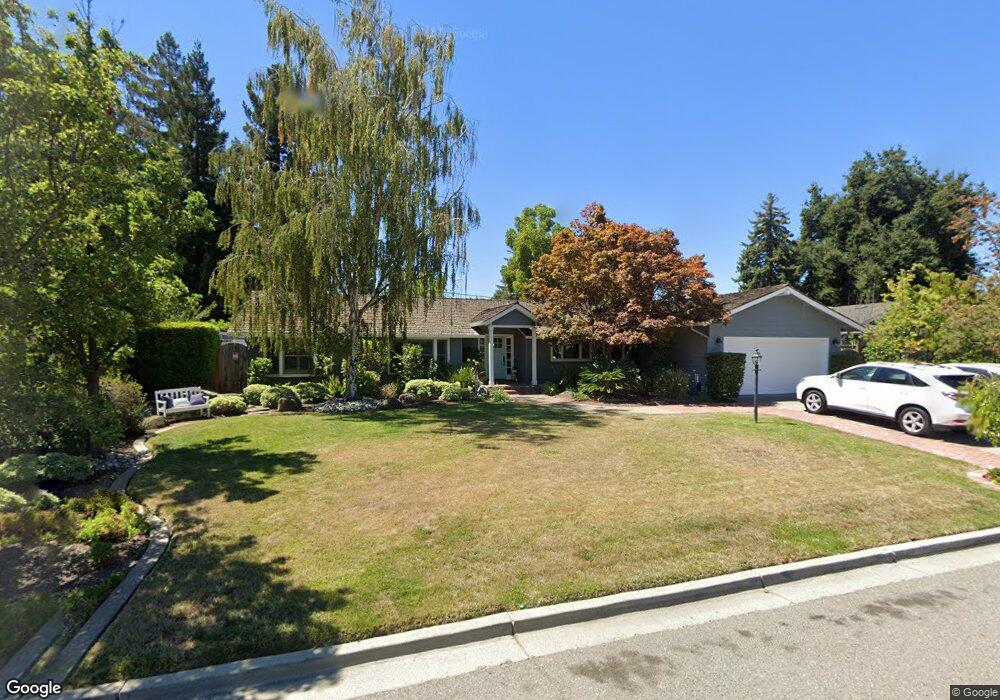
18876 Westview Dr Saratoga, CA 95070
West San Jose NeighborhoodEstimated Value: $3,129,000 - $3,406,000
4
Beds
3
Baths
2,066
Sq Ft
$1,584/Sq Ft
Est. Value
About This Home
This home is located at 18876 Westview Dr, Saratoga, CA 95070 and is currently estimated at $3,273,252, approximately $1,584 per square foot. 18876 Westview Dr is a home located in Santa Clara County with nearby schools including Country Lane Elementary School, Moreland Middle School, and Prospect High School.
Ownership History
Date
Name
Owned For
Owner Type
Purchase Details
Closed on
Nov 8, 2019
Sold by
Dean Gregory E and Dean Cynthia E
Bought by
Dean Gregory E and Dean Cynthia E
Current Estimated Value
Home Financials for this Owner
Home Financials are based on the most recent Mortgage that was taken out on this home.
Original Mortgage
$1,431,000
Outstanding Balance
$1,260,163
Interest Rate
3.65%
Mortgage Type
New Conventional
Estimated Equity
$2,013,089
Purchase Details
Closed on
Jun 16, 2017
Sold by
Dean Gregory E and Dean Cynthia E
Bought by
Dean Gregory E and Dean Cynthia E
Purchase Details
Closed on
Jun 4, 1996
Sold by
Kral Glenn C and Kral Susan S
Bought by
Dean Gregory E and Dean Cynthia E
Home Financials for this Owner
Home Financials are based on the most recent Mortgage that was taken out on this home.
Original Mortgage
$396,000
Interest Rate
7.62%
Purchase Details
Closed on
Oct 11, 1994
Sold by
Kral Glenn C and Kral Susan S
Bought by
Kral Glenn C and Kral Susan S
Create a Home Valuation Report for This Property
The Home Valuation Report is an in-depth analysis detailing your home's value as well as a comparison with similar homes in the area
Home Values in the Area
Average Home Value in this Area
Purchase History
| Date | Buyer | Sale Price | Title Company |
|---|---|---|---|
| Dean Gregory E | -- | Chicago Title Company | |
| Dean Gregory E | -- | None Available | |
| Dean Gregory E | $495,000 | Santa Clara Land Title Co | |
| Kral Glenn C | -- | -- |
Source: Public Records
Mortgage History
| Date | Status | Borrower | Loan Amount |
|---|---|---|---|
| Open | Dean Gregory E | $1,431,000 | |
| Closed | Dean Gregory E | $396,000 |
Source: Public Records
Tax History Compared to Growth
Tax History
| Year | Tax Paid | Tax Assessment Tax Assessment Total Assessment is a certain percentage of the fair market value that is determined by local assessors to be the total taxable value of land and additions on the property. | Land | Improvement |
|---|---|---|---|---|
| 2025 | $11,113 | $832,654 | $369,954 | $462,700 |
| 2024 | $11,113 | $816,328 | $362,700 | $453,628 |
| 2023 | $11,026 | $800,323 | $355,589 | $444,734 |
| 2022 | $10,808 | $784,631 | $348,617 | $436,014 |
| 2021 | $10,643 | $769,247 | $341,782 | $427,465 |
| 2020 | $10,478 | $761,360 | $338,278 | $423,082 |
| 2019 | $10,068 | $746,433 | $331,646 | $414,787 |
| 2018 | $9,865 | $731,798 | $325,144 | $406,654 |
| 2017 | $9,639 | $717,450 | $318,769 | $398,681 |
| 2016 | $9,089 | $703,383 | $312,519 | $390,864 |
| 2015 | $8,988 | $692,818 | $307,825 | $384,993 |
| 2014 | $8,763 | $679,248 | $301,796 | $377,452 |
Source: Public Records
Map
Nearby Homes
- 12584 Paseo Flores
- 12140 Woodside Dr
- 11315 Cottonwood Place Unit 39-09 Plan 3
- 11210 Cottonwood Place Unit 35-08 Plan 4
- 11220 Cottonwood Place Unit 36-08 Plan 2
- 11240 Cottonwood Place Unit 38-08 Plan 3
- Plan 2 at The Elms
- Plan 3 at The Elms
- Plan 4 at The Elms
- 11645 Redwood Place Unit 56-12 Plan 4
- 10750 Elm Cir Unit 88-17 Plan 2
- 11115 Maple Place Unit 30-07
- 11125 Maple Place Unit 31-07 Plan 2
- 11010 Maple Place Unit 25-06 Plan 4
- 11145 Maple Place Unit 33-07 Plan 2
- 11155 Maple Place Unit 34-07 Plan 3
- 10730 Elm Cir Unit 86-17 Plan 2
- 11040 Maple Place Unit 28-06 Plan 2
- 11050 Maple Place Unit 29-06 Plan 3
- 10330 Elm Cir Unit 12-03 Plan 2
- 18892 Westview Dr
- 18860 Westview Dr
- 18911 Cyril Place
- 18921 Cyril Place
- 18877 Westview Dr
- 18861 Westview Dr
- 18908 Westview Dr
- 12431 Curry Ct
- 18893 Westview Dr
- 18900 Cyril Place
- 18845 Westview Dr
- 12441 Curry Ct
- 18909 Westview Dr
- 18924 Westview Dr
- 18829 Westview Dr
- 12320 Obrad Dr
- 18910 Cyril Place
- 18920 Cyril Place
- 12316 Obrad Dr
- 12330 Kosich Ct