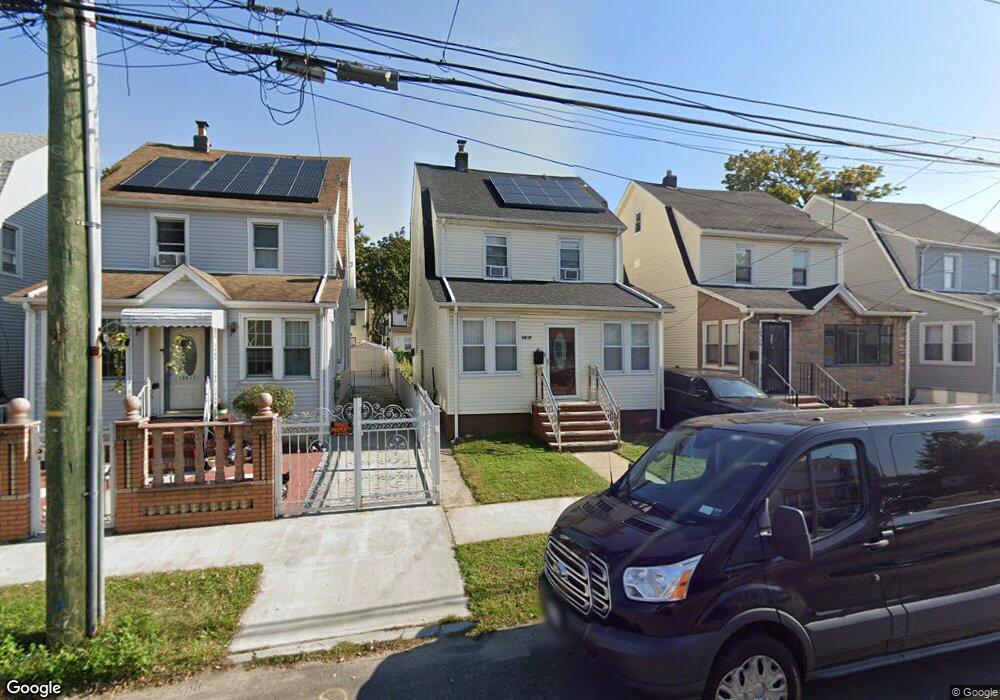
18908 Mangin Ave Saint Albans, NY 11412
Hollis NeighborhoodEstimated Value: $578,928 - $685,000
--
Bed
--
Bath
1,300
Sq Ft
$486/Sq Ft
Est. Value
About This Home
This home is located at 18908 Mangin Ave, Saint Albans, NY 11412 and is currently estimated at $631,232, approximately $485 per square foot. 18908 Mangin Ave is a home located in Queens County with nearby schools including P.S. 118 Lorraine Hansberry, I.S. 192 The Linden, and Riverton Street Charter School.
Ownership History
Date
Name
Owned For
Owner Type
Purchase Details
Closed on
Jun 21, 2001
Sold by
Reid Claudette D
Bought by
Hosang Charleston
Current Estimated Value
Home Financials for this Owner
Home Financials are based on the most recent Mortgage that was taken out on this home.
Original Mortgage
$166,250
Outstanding Balance
$63,652
Interest Rate
7.21%
Estimated Equity
$567,580
Purchase Details
Closed on
Jul 18, 1997
Sold by
Viva Development Corp
Bought by
Reid Claudette D
Home Financials for this Owner
Home Financials are based on the most recent Mortgage that was taken out on this home.
Original Mortgage
$161,044
Interest Rate
7.47%
Purchase Details
Closed on
Mar 19, 1997
Sold by
Hubbard Gay M and Archer Greg
Bought by
Viva Development Corp
Purchase Details
Closed on
Mar 15, 1995
Sold by
Archer Sybil M
Bought by
Hubbard Gay M and Archer Greg
Create a Home Valuation Report for This Property
The Home Valuation Report is an in-depth analysis detailing your home's value as well as a comparison with similar homes in the area
Home Values in the Area
Average Home Value in this Area
Purchase History
| Date | Buyer | Sale Price | Title Company |
|---|---|---|---|
| Hosang Charleston | -- | -- | |
| Hosang Charleston | -- | -- | |
| Reid Claudette D | $163,000 | -- | |
| Reid Claudette D | $163,000 | -- | |
| Viva Development Corp | $105,000 | First American Title Ins Co | |
| Viva Development Corp | $105,000 | First American Title Ins Co | |
| Hubbard Gay M | -- | First American Title Ins Co | |
| Hubbard Gay M | -- | First American Title Ins Co |
Source: Public Records
Mortgage History
| Date | Status | Borrower | Loan Amount |
|---|---|---|---|
| Open | Hosang Charleston | $166,250 | |
| Closed | Hosang Charleston | $166,250 | |
| Previous Owner | Reid Claudette D | $161,044 |
Source: Public Records
Tax History Compared to Growth
Tax History
| Year | Tax Paid | Tax Assessment Tax Assessment Total Assessment is a certain percentage of the fair market value that is determined by local assessors to be the total taxable value of land and additions on the property. | Land | Improvement |
|---|---|---|---|---|
| 2025 | $4,877 | $25,091 | $7,354 | $17,737 |
| 2024 | $3,842 | $24,283 | $6,810 | $17,473 |
| 2023 | $4,718 | $23,491 | $6,334 | $17,157 |
| 2022 | $4,424 | $36,600 | $10,920 | $25,680 |
| 2021 | $4,400 | $34,440 | $10,920 | $23,520 |
| 2020 | $4,426 | $32,160 | $10,920 | $21,240 |
| 2019 | $4,233 | $30,840 | $10,920 | $19,920 |
| 2018 | $3,991 | $19,576 | $7,629 | $11,947 |
| 2017 | $3,765 | $18,469 | $7,799 | $10,670 |
| 2016 | $3,483 | $18,469 | $7,799 | $10,670 |
| 2015 | $2,101 | $17,424 | $9,262 | $8,162 |
| 2014 | $2,101 | $16,864 | $10,746 | $6,118 |
Source: Public Records
Map
Nearby Homes
- 18833 Keeseville Ave
- 187-44 Jordan Ave
- 188-25 Mangin Ave
- 18823 Mangin Ave
- 188-31 Jordan Ave
- 111-06 Farmers Blvd
- 188-07 Mangin Ave
- 19022 111th Rd
- 186-16 Hilburn Ave
- 191-40 112th Rd
- 190-59 112th Ave
- 190-63 112th Ave
- 18908 114th Rd
- 194-16 112th Ave
- 19404 110th Rd
- 187-23 Brinkerhoff Ave
- 194- 24 111th Rd
- 194-29 112th Ave
- 183-34 Fonda Ave
- 10533 Farmers Blvd
- 18906 Mangin Ave
- 18912 Mangin Ave
- 189-12 Mangin Ave
- 18902 Mangin Ave
- 18914 Mangin Ave
- 18918 Mangin Ave
- 18907 Keeseville Ave
- 18909 Keeseville Ave
- 18903 Keeseville Ave
- 189-07 Keeseville Ave
- 18911 Keeseville Ave
- 18901 Keeseville Ave
- 18920 Mangin Ave
- 18915 Keeseville Ave
- 18909 Keeseville Ave
- 18848 Mangin Ave
- 189-13 Mangin Ave
- 18922 Mangin Ave
- 189-15 Keeseville Ave