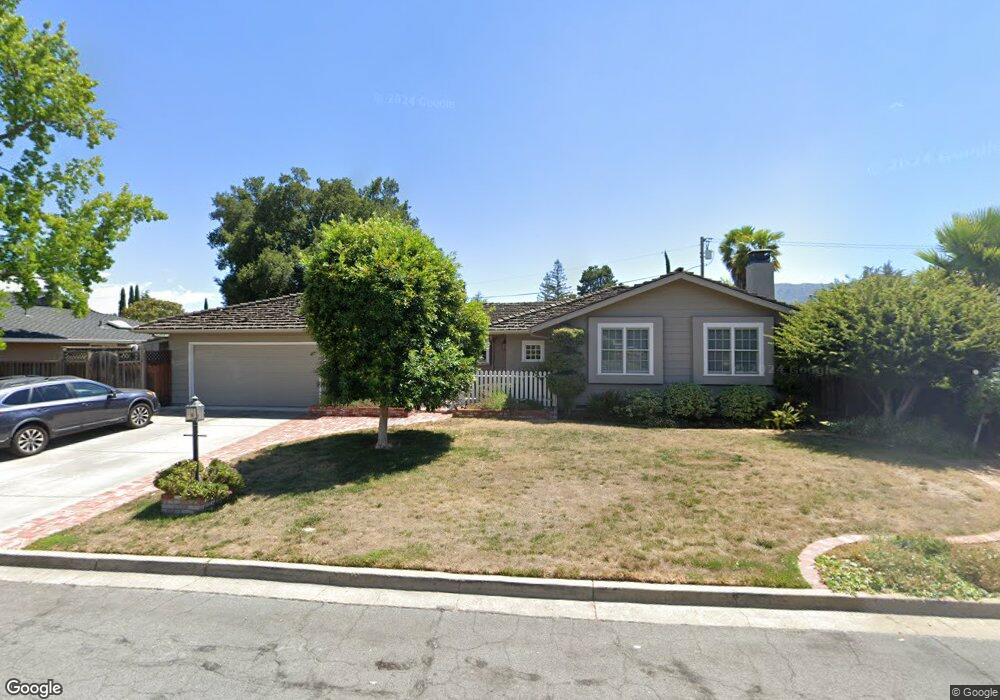
18910 Twain Ct Saratoga, CA 95070
Portos NeighborhoodEstimated Value: $3,164,000 - $4,148,000
3
Beds
2
Baths
1,731
Sq Ft
$2,076/Sq Ft
Est. Value
About This Home
This home is located at 18910 Twain Ct, Saratoga, CA 95070 and is currently estimated at $3,593,085, approximately $2,075 per square foot. 18910 Twain Ct is a home located in Santa Clara County with nearby schools including Argonaut Elementary School, Saratoga Elementary School, and Foothill Elementary School.
Ownership History
Date
Name
Owned For
Owner Type
Purchase Details
Closed on
Oct 22, 2018
Sold by
Mcintosh Donald F J and Mcintosh Rachael T
Bought by
Mcintosh Donald F J and Mcintosh Rachael T
Current Estimated Value
Home Financials for this Owner
Home Financials are based on the most recent Mortgage that was taken out on this home.
Original Mortgage
$110,000
Outstanding Balance
$96,131
Interest Rate
4.6%
Mortgage Type
VA
Estimated Equity
$3,496,954
Purchase Details
Closed on
Jun 24, 1998
Sold by
Mirzadegan Abdy and Mirzadegan Azita
Bought by
Mcintosh Donald F J and Mcintosh Rachel T
Purchase Details
Closed on
Oct 9, 1995
Sold by
Hinshaw Bradford J and Hinshaw Laurie
Bought by
Mirzadegan Abdy and Mirzadegan Azita
Home Financials for this Owner
Home Financials are based on the most recent Mortgage that was taken out on this home.
Original Mortgage
$398,000
Interest Rate
7.75%
Create a Home Valuation Report for This Property
The Home Valuation Report is an in-depth analysis detailing your home's value as well as a comparison with similar homes in the area
Home Values in the Area
Average Home Value in this Area
Purchase History
| Date | Buyer | Sale Price | Title Company |
|---|---|---|---|
| Mcintosh Donald F J | -- | None Available | |
| Mcintosh Jr Donald F J | -- | Old Republic Title | |
| Mcintosh Donald F J | $800,000 | Chicago Title Co | |
| Mirzadegan Abdy | $497,000 | American Title Ins Co |
Source: Public Records
Mortgage History
| Date | Status | Borrower | Loan Amount |
|---|---|---|---|
| Open | Mcintosh Jr Donald F J | $110,000 | |
| Previous Owner | Mirzadegan Abdy | $398,000 |
Source: Public Records
Tax History Compared to Growth
Tax History
| Year | Tax Paid | Tax Assessment Tax Assessment Total Assessment is a certain percentage of the fair market value that is determined by local assessors to be the total taxable value of land and additions on the property. | Land | Improvement |
|---|---|---|---|---|
| 2025 | $8,999 | $891,147 | $290,049 | $601,098 |
| 2024 | $8,999 | $873,674 | $284,362 | $589,312 |
| 2023 | $9,008 | $856,544 | $278,787 | $577,757 |
| 2022 | $8,934 | $839,750 | $273,321 | $566,429 |
| 2021 | $8,766 | $823,285 | $267,962 | $555,323 |
| 2020 | $8,600 | $814,844 | $265,215 | $549,629 |
| 2019 | $8,459 | $798,867 | $260,015 | $538,852 |
| 2018 | $8,324 | $783,204 | $254,917 | $528,287 |
| 2017 | $8,293 | $767,848 | $249,919 | $517,929 |
| 2016 | $8,042 | $752,793 | $245,019 | $507,774 |
| 2015 | $7,852 | $741,486 | $241,339 | $500,147 |
| 2014 | $7,658 | $726,962 | $236,612 | $490,350 |
Source: Public Records
Map
Nearby Homes
- 13550 Myren Dr
- 13446 Alvarado Ct
- 14001 Chester Ave
- 18732 Afton Ave
- 18677 Mccoy Ave
- 19113 Vineyard Ln
- 11010 Maple Place Unit 25-06 Plan 4
- 10730 Elm Cir Unit 86-17 Plan 2
- 19423 Vineyard Ln
- 10750 Elm Cir Unit 88-17 Plan 2
- 4994 Peach Terrace
- 10330 Elm Cir Unit 12-03 Plan 2
- 11040 Maple Place Unit 28-06 Plan 2
- 11050 Maple Place Unit 29-06 Plan 3
- 11645 Redwood Place Unit 56-12 Plan 4
- Plan 2 at The Elms
- Plan 3 at The Elms
- Plan 4 at The Elms
- 11115 Maple Place Unit 30-07
- 11125 Maple Place Unit 31-07 Plan 2
- 18892 Twain Ct
- 18920 Twain Ct
- 18911 Alcott Way
- 18929 Alcott Way
- 13745 Manteca Way
- 18911 Twain Ct
- 13685 Manteca Way
- 18930 Twain Ct
- 18921 Twain Ct
- 18947 Alcott Way
- 18931 Twain Ct
- 13730 Manteca Way
- 13714 Manteca Way
- 13746 Manteca Way
- 18910 Harleigh Dr
- 18920 Alcott Way
- 13698 Manteca Way
- 18900 Alcott Way
- 18928 Harleigh Dr
- 13671 Manteca Way