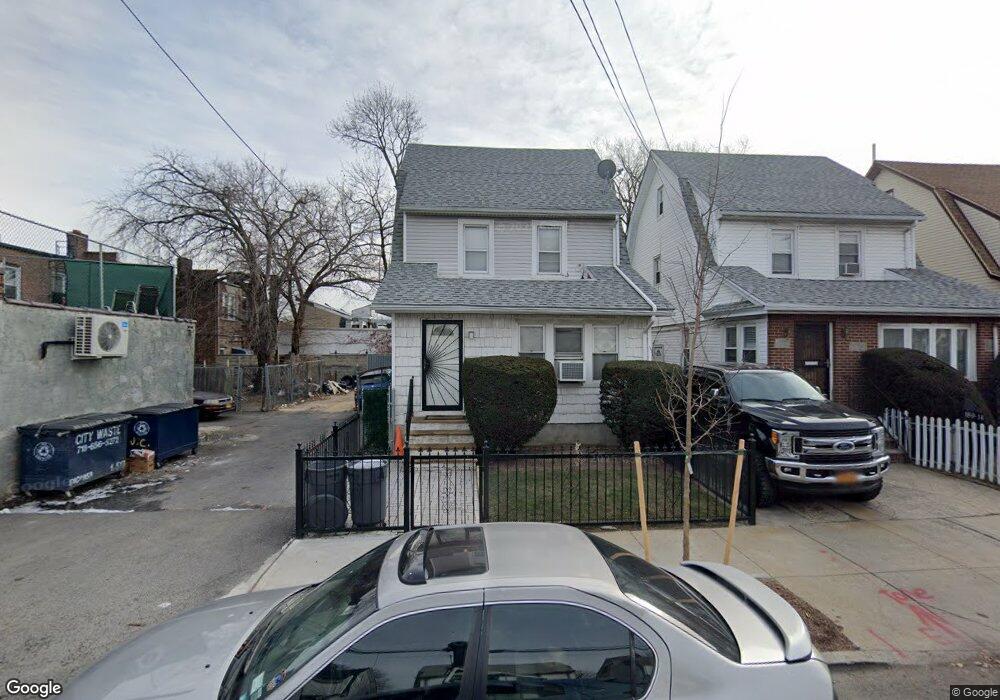
18918 Keeseville Ave Saint Albans, NY 11412
Hollis NeighborhoodEstimated Value: $716,229 - $899,000
--
Bed
--
Bath
1,570
Sq Ft
$513/Sq Ft
Est. Value
About This Home
This home is located at 18918 Keeseville Ave, Saint Albans, NY 11412 and is currently estimated at $805,557, approximately $513 per square foot. 18918 Keeseville Ave is a home located in Queens County with nearby schools including P.S. 118 Lorraine Hansberry, I.S. 192 The Linden, and Riverton Street Charter School.
Ownership History
Date
Name
Owned For
Owner Type
Purchase Details
Closed on
Jan 19, 2023
Sold by
Huitt Elaine
Bought by
Byam Edward and Huitt Elaine
Current Estimated Value
Purchase Details
Closed on
Feb 7, 2007
Sold by
Newell Dan
Bought by
Huitt Elaine
Purchase Details
Closed on
Mar 23, 2006
Sold by
Byam Edward T
Bought by
Newell Dan
Home Financials for this Owner
Home Financials are based on the most recent Mortgage that was taken out on this home.
Original Mortgage
$24,250
Interest Rate
6.26%
Purchase Details
Closed on
Oct 14, 2004
Sold by
Byam Edward and Byam Naomi
Bought by
Byam Edward
Purchase Details
Closed on
Jan 21, 1999
Sold by
Byam Naomi
Bought by
Byam Naomi and Byam Edward
Purchase Details
Closed on
Oct 9, 1997
Sold by
Byam Adrienne F
Bought by
Byam Naomi
Create a Home Valuation Report for This Property
The Home Valuation Report is an in-depth analysis detailing your home's value as well as a comparison with similar homes in the area
Home Values in the Area
Average Home Value in this Area
Purchase History
| Date | Buyer | Sale Price | Title Company |
|---|---|---|---|
| Byam Edward | -- | -- | |
| Byam Edward | -- | -- | |
| Huitt Elaine | $550,000 | -- | |
| Huitt Elaine | $550,000 | -- | |
| Newell Dan | $485,000 | -- | |
| Newell Dan | $485,000 | -- | |
| Byam Edward | -- | -- | |
| Byam Edward | -- | -- | |
| Byam Naomi | -- | Stewart Title Insurance Co | |
| Byam Naomi | -- | Stewart Title Insurance Co | |
| Byam Naomi | -- | -- | |
| Byam Naomi | -- | -- |
Source: Public Records
Mortgage History
| Date | Status | Borrower | Loan Amount |
|---|---|---|---|
| Previous Owner | Newell Dan | $24,250 | |
| Previous Owner | Newell Dan | $436,500 | |
| Closed | Byam Edward | $0 |
Source: Public Records
Tax History Compared to Growth
Tax History
| Year | Tax Paid | Tax Assessment Tax Assessment Total Assessment is a certain percentage of the fair market value that is determined by local assessors to be the total taxable value of land and additions on the property. | Land | Improvement |
|---|---|---|---|---|
| 2025 | $4,916 | $27,427 | $9,362 | $18,065 |
| 2024 | $4,928 | $25,878 | $9,478 | $16,400 |
| 2023 | $4,916 | $25,878 | $8,555 | $17,323 |
| 2022 | $4,680 | $36,420 | $14,460 | $21,960 |
| 2021 | $4,803 | $31,800 | $14,460 | $17,340 |
| 2020 | $4,542 | $32,340 | $14,460 | $17,880 |
| 2019 | $4,218 | $32,880 | $14,460 | $18,420 |
| 2018 | $4,098 | $21,565 | $10,052 | $11,513 |
| 2017 | $3,927 | $20,736 | $9,995 | $10,741 |
| 2016 | $3,726 | $20,736 | $9,995 | $10,741 |
| 2015 | $2,140 | $19,047 | $12,096 | $6,951 |
| 2014 | $2,140 | $17,971 | $12,381 | $5,590 |
Source: Public Records
Map
Nearby Homes
- 18833 Keeseville Ave
- 188-25 Mangin Ave
- 187-44 Jordan Ave
- 18823 Mangin Ave
- 19022 111th Rd
- 111-06 Farmers Blvd
- 188-07 Mangin Ave
- 188-31 Jordan Ave
- 191-40 112th Rd
- 190-59 112th Ave
- 186-16 Hilburn Ave
- 190-63 112th Ave
- 18908 114th Rd
- 194-16 112th Ave
- 194- 24 111th Rd
- 19404 110th Rd
- 194-29 112th Ave
- 191-16 114th Rd
- 187-23 Brinkerhoff Ave
- 10533 Farmers Blvd
- 189-14 Keeseville Ave
- 18914 Keeseville Ave
- 18912 Keeseville Ave
- 189-12 Keeseville Ave
- 11208 Farmers Blvd
- 11206 Farmers Blvd
- 11204 Farmers Blvd
- 18908 Keeseville Ave
- 18908 Keeseville Ave Unit 1 FLOOR
- 18908 Keeseville Ave
- 19011 Lewiston Ave
- 11210 Farmers Blvd
- 11220 Farmers Blvd
- 19011 Lewiston Ave
- 11202 Farmers Blvd
- 18904 Keeseville Ave
- 19007 Lewiston Ave
- 112-20 Farmers Blvd
- 189-17 Keeseville Ave
- 189-15 Keeseville Ave