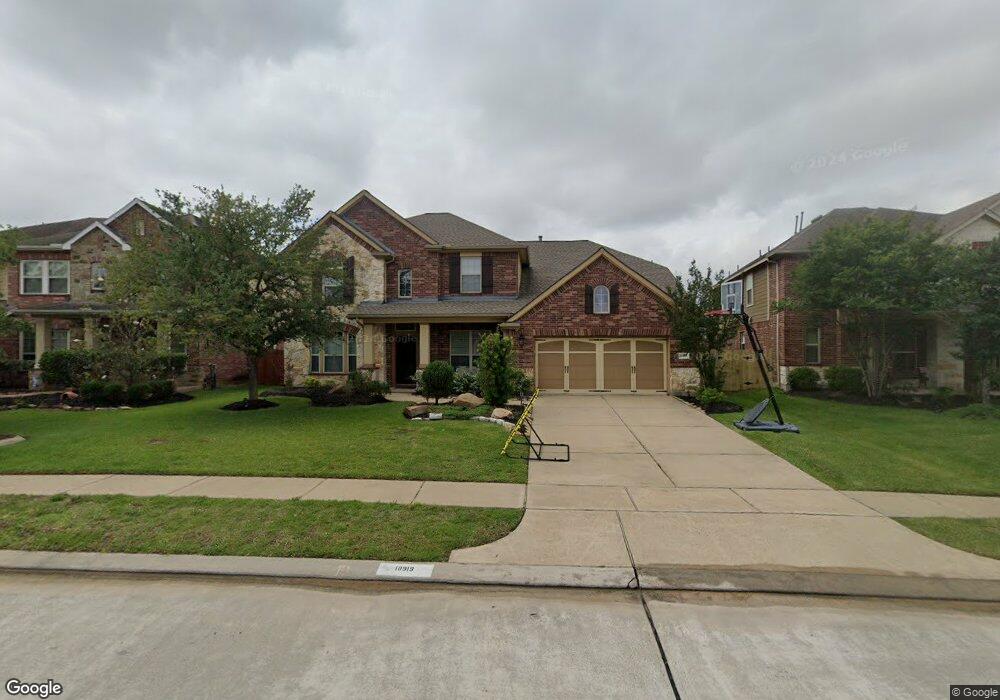
18919 Emery Meadows Ln Tomball, TX 77377
Northpointe NeighborhoodEstimated Value: $517,897 - $561,000
4
Beds
4
Baths
3,468
Sq Ft
$156/Sq Ft
Est. Value
About This Home
This home is located at 18919 Emery Meadows Ln, Tomball, TX 77377 and is currently estimated at $540,974, approximately $155 per square foot. 18919 Emery Meadows Ln is a home located in Harris County with nearby schools including Canyon Pointe Elementary School, Oakcrest Intermediate School, and Tomball Memorial High School.
Ownership History
Date
Name
Owned For
Owner Type
Purchase Details
Closed on
Jul 19, 2012
Sold by
Priority Relocation Company Llc
Bought by
Holliday Charles and Holliday Margaret
Current Estimated Value
Home Financials for this Owner
Home Financials are based on the most recent Mortgage that was taken out on this home.
Original Mortgage
$257,645
Outstanding Balance
$178,521
Interest Rate
3.75%
Mortgage Type
FHA
Estimated Equity
$362,453
Purchase Details
Closed on
Apr 29, 2011
Sold by
Wilson Nicholas J and Wilson Marie
Bought by
Priority Relocation Company Llc
Purchase Details
Closed on
Dec 23, 2009
Sold by
Weekley Homes Lp
Bought by
Wilson Nicholas J and Wilson Marie
Home Financials for this Owner
Home Financials are based on the most recent Mortgage that was taken out on this home.
Original Mortgage
$306,000
Interest Rate
4.8%
Mortgage Type
VA
Purchase Details
Closed on
Jul 9, 2009
Sold by
Blue Ridge Partners Ltd
Bought by
Weekley Homes Lp
Create a Home Valuation Report for This Property
The Home Valuation Report is an in-depth analysis detailing your home's value as well as a comparison with similar homes in the area
Home Values in the Area
Average Home Value in this Area
Purchase History
| Date | Buyer | Sale Price | Title Company |
|---|---|---|---|
| Holliday Charles | -- | None Available | |
| Priority Relocation Company Llc | -- | Priority Title Co | |
| Wilson Nicholas J | -- | Priority Title Co | |
| Weekley Homes Lp | -- | Priority Title Company |
Source: Public Records
Mortgage History
| Date | Status | Borrower | Loan Amount |
|---|---|---|---|
| Open | Holliday Charles | $257,645 | |
| Previous Owner | Wilson Nicholas J | $306,000 |
Source: Public Records
Tax History Compared to Growth
Tax History
| Year | Tax Paid | Tax Assessment Tax Assessment Total Assessment is a certain percentage of the fair market value that is determined by local assessors to be the total taxable value of land and additions on the property. | Land | Improvement |
|---|---|---|---|---|
| 2025 | $9,723 | $571,241 | $95,922 | $475,319 |
| 2024 | $9,723 | $500,000 | $95,922 | $404,078 |
| 2023 | $9,723 | $496,614 | $92,191 | $404,423 |
| 2022 | $10,041 | $375,000 | $73,541 | $301,459 |
| 2021 | $10,236 | $366,045 | $69,278 | $296,767 |
| 2020 | $10,032 | $342,553 | $69,278 | $273,275 |
| 2019 | $10,234 | $339,605 | $65,014 | $274,591 |
| 2018 | $4,496 | $335,531 | $65,014 | $270,517 |
| 2017 | $10,243 | $335,531 | $65,014 | $270,517 |
| 2016 | $10,243 | $335,531 | $65,014 | $270,517 |
| 2015 | $10,671 | $335,531 | $65,014 | $270,517 |
| 2014 | $10,671 | $321,768 | $61,284 | $260,484 |
Source: Public Records
Map
Nearby Homes
- 18903 Danbridge Ct
- 18814 Emery Meadows Ln
- 12610 Baldwin Springs Ct
- 12414 Montebello Manor Ln
- 12427 Point Arbor Ct
- 18703 Summercliff Ln
- 12719 Rocky Briar Ln
- 18803 Dusty Rose Ln
- 19114 Canyon Vista Ct
- 12623 Ember Village Ln
- 19006 Rustling Ridge Ln
- 19026 Rustling Ridge Ln
- 18522 Cascade Timbers Ln
- 18135 Gravenhurst Ln
- 12022 Canyon Star Ln
- 12006 Canyon Star Ln
- 18603 Bridle Grove Ct
- 19010 Canyon Star Ct
- 18402 Sierra Falls Ct
- 14111 Boudreaux Rd
- 18923 Emery Meadows Ln
- 18915 Emery Meadows Ln
- 18927 Emery Meadows Ln
- 18914 Emery Meadows Ln
- 18931 Emery Meadows Ln
- 18922 Emery Meadows Ln
- 12402 Northpointe Bend Dr
- 18906 Emery Meadows Ln
- 12406 Northpointe Bend Dr
- 18935 Emery Meadows Ln
- 18926 Emery Meadows Ln
- 12410 Northpointe Bend Dr
- 12414 Northpointe Bend Dr
- 18930 Emery Meadows Ln
- 12418 Northpointe Bend Dr
- 18934 Emery Meadows Ln
- 18826 Emery Meadows Ln
- 12423 Northpointe Bend Dr
- 18906 Manor Spring Ct
- 12435 Northpointe Bend Dr