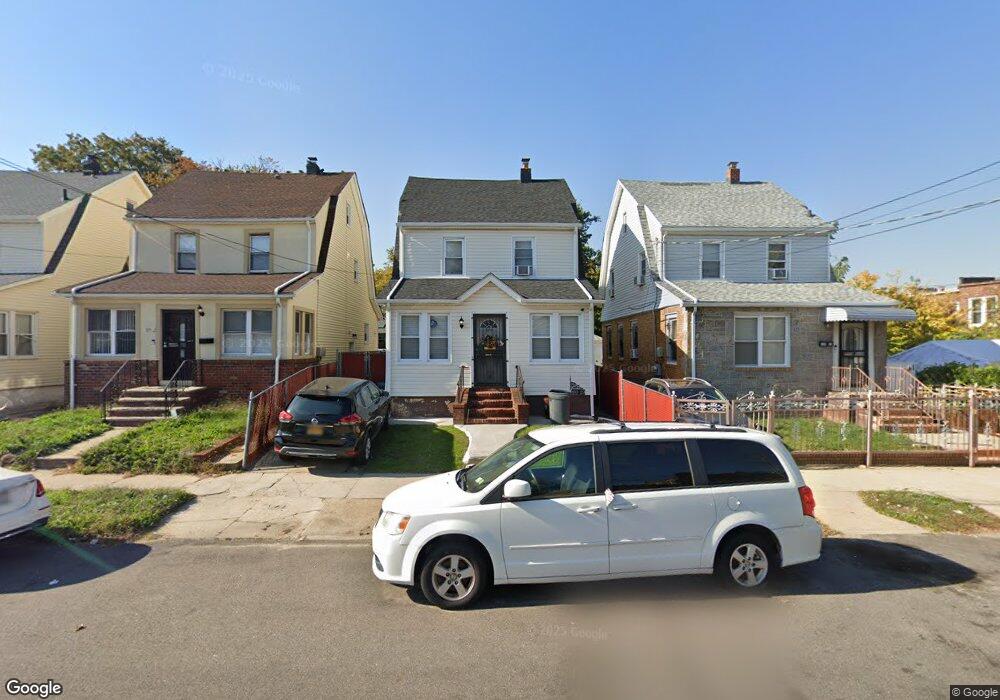
18929 Mangin Ave Saint Albans, NY 11412
Hollis NeighborhoodEstimated Value: $635,514 - $796,000
--
Bed
--
Bath
1,632
Sq Ft
$446/Sq Ft
Est. Value
About This Home
This home is located at 18929 Mangin Ave, Saint Albans, NY 11412 and is currently estimated at $727,129, approximately $445 per square foot. 18929 Mangin Ave is a home located in Queens County with nearby schools including P.S. 118 Lorraine Hansberry, I.S. 192 The Linden, and Riverton Street Charter School.
Ownership History
Date
Name
Owned For
Owner Type
Purchase Details
Closed on
Mar 16, 1998
Sold by
Better Homes Depot Inc
Bought by
Wong Linda C and Heyward George J
Current Estimated Value
Home Financials for this Owner
Home Financials are based on the most recent Mortgage that was taken out on this home.
Original Mortgage
$162,424
Outstanding Balance
$29,950
Interest Rate
7.11%
Mortgage Type
FHA
Estimated Equity
$697,179
Create a Home Valuation Report for This Property
The Home Valuation Report is an in-depth analysis detailing your home's value as well as a comparison with similar homes in the area
Home Values in the Area
Average Home Value in this Area
Purchase History
| Date | Buyer | Sale Price | Title Company |
|---|---|---|---|
| Wong Linda C | $169,000 | Chicago Title Insurance Co |
Source: Public Records
Mortgage History
| Date | Status | Borrower | Loan Amount |
|---|---|---|---|
| Open | Wong Linda C | $162,424 |
Source: Public Records
Tax History Compared to Growth
Tax History
| Year | Tax Paid | Tax Assessment Tax Assessment Total Assessment is a certain percentage of the fair market value that is determined by local assessors to be the total taxable value of land and additions on the property. | Land | Improvement |
|---|---|---|---|---|
| 2025 | $5,267 | $27,769 | $7,757 | $20,012 |
| 2024 | $5,267 | $26,225 | $6,886 | $19,339 |
| 2023 | $5,254 | $26,161 | $7,407 | $18,754 |
| 2022 | $4,927 | $38,940 | $11,280 | $27,660 |
| 2021 | $5,157 | $37,740 | $11,280 | $26,460 |
| 2020 | $4,898 | $33,720 | $11,280 | $22,440 |
| 2019 | $4,572 | $28,860 | $11,280 | $17,580 |
| 2018 | $4,444 | $21,801 | $8,330 | $13,471 |
| 2017 | $4,193 | $20,568 | $8,768 | $11,800 |
| 2016 | $4,082 | $20,568 | $8,768 | $11,800 |
| 2015 | $2,340 | $19,284 | $10,441 | $8,843 |
| 2014 | $2,340 | $18,212 | $10,722 | $7,490 |
Source: Public Records
Map
Nearby Homes
- 187-44 Jordan Ave
- 188-31 Jordan Ave
- 188-25 Mangin Ave
- 111-06 Farmers Blvd
- 18823 Mangin Ave
- 18833 Keeseville Ave
- 188-07 Mangin Ave
- 186-16 Hilburn Ave
- 19022 111th Rd
- 187-23 Brinkerhoff Ave
- 190-59 112th Ave
- 191-40 112th Rd
- 190-63 112th Ave
- 183-34 Fonda Ave
- 10533 Farmers Blvd
- 19027 109th Rd
- 19404 110th Rd
- 183-29 Brinkerhoff Ave
- 18908 114th Rd
- 194-16 112th Ave
- 18931 Mangin Ave
- 18925 Mangin Ave
- 189-25 Mangin Ave
- 189-25 Mangin Ave
- 189-25 Mangin Ave
- 189-25 Mangin Ave
- 189-25 Mangin Ave
- 189-25 Mangin Ave
- 189-25 Mangin Ave
- 18923 Mangin Ave
- 18923 Mangin Ave Unit 1
- 18923 Mangin Ave
- 18919 Mangin Ave
- 11118 Farmers Blvd
- 11116 Farmers Blvd
- 11120 Farmers Blvd
- 111-20 Farmers Blvd
- 18826 Jordan Ave
- 18830 Jordan Ave
- 11112 Farmers Blvd