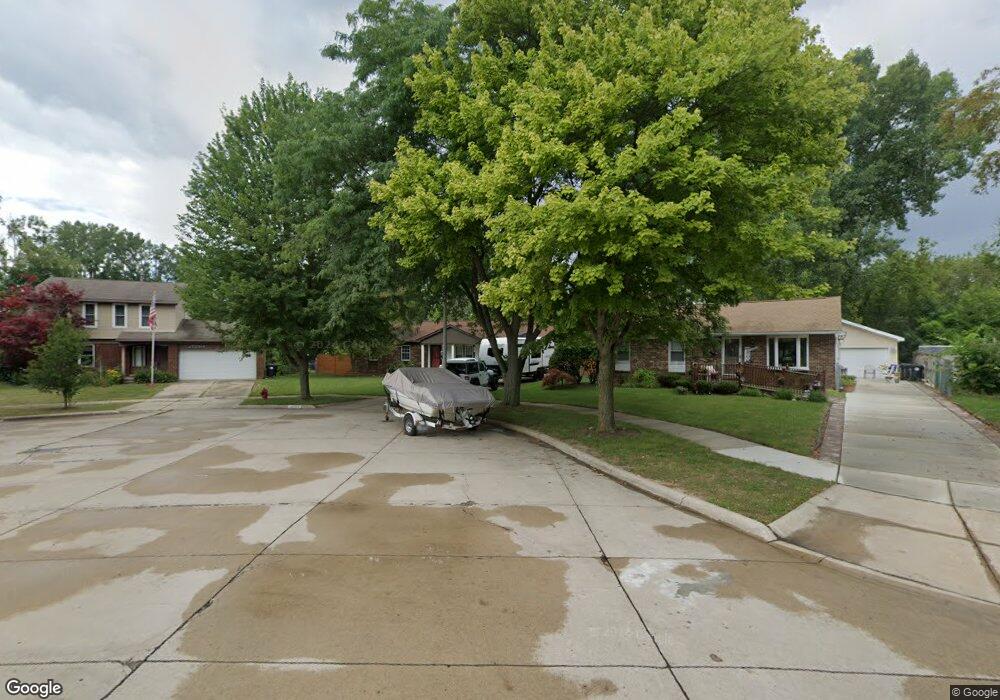
18972 Orleans Place Unit Bldg-Unit Woodhaven, MI 48183
Estimated Value: $264,000 - $282,000
--
Bed
2
Baths
1,266
Sq Ft
$213/Sq Ft
Est. Value
About This Home
This home is located at 18972 Orleans Place Unit Bldg-Unit, Woodhaven, MI 48183 and is currently estimated at $270,109, approximately $213 per square foot. 18972 Orleans Place Unit Bldg-Unit is a home located in Wayne County with nearby schools including Oscar A. Carlson High School and St. Joseph Elementary School.
Ownership History
Date
Name
Owned For
Owner Type
Purchase Details
Closed on
Feb 1, 2018
Sold by
Martinez Luis and Martinez Alicia
Bought by
Wilcox Patrick L
Current Estimated Value
Home Financials for this Owner
Home Financials are based on the most recent Mortgage that was taken out on this home.
Original Mortgage
$149,246
Outstanding Balance
$128,338
Interest Rate
4.62%
Mortgage Type
FHA
Estimated Equity
$141,771
Purchase Details
Closed on
Oct 11, 2011
Sold by
Nationstar Mortgage Llc
Bought by
Fannie Mae and Federal National Mortgage Association
Purchase Details
Closed on
Oct 5, 2011
Sold by
Molnar Gerald and Molnar Ginger R
Bought by
Nationstar Mortgage Llc
Purchase Details
Closed on
Mar 30, 2000
Sold by
Elaine Tadajewski
Bought by
Gerald S Molnar
Purchase Details
Closed on
Jul 19, 1996
Sold by
Norma Jean Schomacker Tr
Bought by
Tadajewski Elaine M and Tadajewski Paul A
Create a Home Valuation Report for This Property
The Home Valuation Report is an in-depth analysis detailing your home's value as well as a comparison with similar homes in the area
Home Values in the Area
Average Home Value in this Area
Purchase History
| Date | Buyer | Sale Price | Title Company |
|---|---|---|---|
| Wilcox Patrick L | $152,000 | Devon Title Agency | |
| Fannie Mae | -- | None Available | |
| Nationstar Mortgage Llc | $143,504 | None Available | |
| Gerald S Molnar | $147,000 | -- | |
| Tadajewski Elaine M | $108,000 | -- | |
| Schomacker Trust Norma J Schomacker & Norma J | $108,000 | -- |
Source: Public Records
Mortgage History
| Date | Status | Borrower | Loan Amount |
|---|---|---|---|
| Open | Wilcox Patrick L | $149,246 |
Source: Public Records
Tax History Compared to Growth
Tax History
| Year | Tax Paid | Tax Assessment Tax Assessment Total Assessment is a certain percentage of the fair market value that is determined by local assessors to be the total taxable value of land and additions on the property. | Land | Improvement |
|---|---|---|---|---|
| 2025 | $4,081 | $112,900 | $0 | $0 |
| 2024 | $4,081 | $110,800 | $0 | $0 |
| 2023 | $4,018 | $100,900 | $0 | $0 |
| 2022 | $4,309 | $90,900 | $0 | $0 |
| 2021 | $4,162 | $83,700 | $0 | $0 |
| 2020 | $4,108 | $82,900 | $0 | $0 |
| 2019 | $4,022 | $76,300 | $0 | $0 |
| 2018 | $2,730 | $71,900 | $0 | $0 |
| 2017 | $679 | $69,400 | $0 | $0 |
| 2016 | $4,083 | $66,700 | $0 | $0 |
| 2015 | $5,646 | $62,000 | $0 | $0 |
| 2013 | $5,470 | $56,900 | $0 | $0 |
| 2012 | $2,429 | $49,600 | $14,200 | $35,400 |
Source: Public Records
Map
Nearby Homes
- 25066 Maywood St
- 25419 Montebello Dr
- 25525 Montebello Ct
- 24995 Allen Rd
- 25260 Reeck Rd
- 4641 Leisure Ln
- 19043 Hyde Park Dr
- 19117 Hyde Park Ct
- 5056 Lisa Ct
- 4687 Jackson St
- 4986 Jackson St
- Vacant Land - Allen Rd
- 5035 Hillcrest Ct
- 4843 Valley Rd
- 3249 Van Horn Rd
- 26654 Kirkway Dr
- 3245 Van Horn Rd
- 3281 Brookshire St
- 4600 Dolores Dr
- 26659 Pepperwood Dr
- 18972 Orleans Place
- 25204 Castlewood Dr
- 18960 Orleans Place
- 18948 Orleans Place
- 25214 Castlewood Dr
- 18936 Orleans Place
- 25226 Castlewood Dr
- 18949 Orleans Place
- 18922 Orleans Place
- 18937 Orleans Place
- 25238 Castlewood Dr
- 25243 Castlewood Dr
- 18923 Orleans Place
- 25058 Montebello Dr
- 18908 Orleans Place
- 25250 Castlewood Dr
- 25046 Montebello Dr
- 25034 Montebello Dr
- 25255 Castlewood Dr
- 18909 Orleans Place