18990 Saratoga Glen Place Saratoga, CA 95070
West San Jose NeighborhoodEstimated Value: $2,854,000 - $3,367,782
4
Beds
3
Baths
1,826
Sq Ft
$1,734/Sq Ft
Est. Value
About This Home
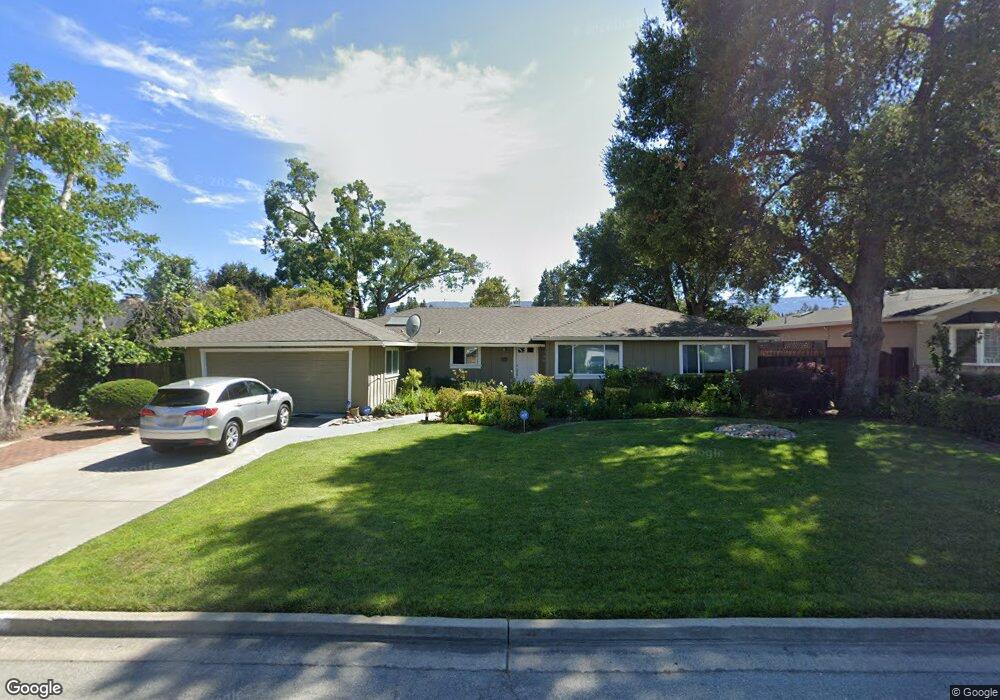
This home is located at 18990 Saratoga Glen Place, Saratoga, CA 95070 and is currently estimated at $3,166,196, approximately $1,733 per square foot. 18990 Saratoga Glen Place is a home located in Santa Clara County with nearby schools including Country Lane Elementary School, Moreland Middle School, and Prospect High School.
Ownership History
Date
Name
Owned For
Owner Type
Purchase Details
Closed on
Jun 22, 2022
Sold by
Mehrnaz Hamedani
Bought by
Hamedani Family Revocable Trust
Current Estimated Value
Purchase Details
Closed on
Oct 17, 2011
Sold by
Greenquest Home Solutions
Bought by
Hamedani Mehrnaz
Purchase Details
Closed on
Feb 22, 2011
Sold by
Pbr Services Llc
Bought by
Greenquest Home Solutions
Home Financials for this Owner
Home Financials are based on the most recent Mortgage that was taken out on this home.
Original Mortgage
$910,000
Interest Rate
4.77%
Mortgage Type
Construction
Purchase Details
Closed on
Oct 15, 2003
Sold by
Smith Danne E
Bought by
Pbr Services Llc
Purchase Details
Closed on
May 5, 1995
Sold by
Styles Frederick J and Styles Anne S
Bought by
Smith Danne E
Home Financials for this Owner
Home Financials are based on the most recent Mortgage that was taken out on this home.
Original Mortgage
$330,000
Interest Rate
7.5%
Create a Home Valuation Report for This Property
The Home Valuation Report is an in-depth analysis detailing your home's value as well as a comparison with similar homes in the area
Home Values in the Area
Average Home Value in this Area
Purchase History
| Date | Buyer | Sale Price | Title Company |
|---|---|---|---|
| Hamedani Family Revocable Trust | -- | None Listed On Document | |
| Hamedani Mehrnaz | $1,260,000 | Fidelity National Title Co | |
| Hamedani Mehrnaz | -- | Fidelity National Title Co | |
| Greenquest Home Solutions | $1,035,000 | Fidelity National Title Co | |
| Pbr Services Llc | $875,000 | First American Title Co | |
| Smith Danne E | $480,000 | Stewart Title |
Source: Public Records
Mortgage History
| Date | Status | Borrower | Loan Amount |
|---|---|---|---|
| Previous Owner | Greenquest Home Solutions | $910,000 | |
| Previous Owner | Smith Danne E | $330,000 |
Source: Public Records
Tax History Compared to Growth
Tax History
| Year | Tax Paid | Tax Assessment Tax Assessment Total Assessment is a certain percentage of the fair market value that is determined by local assessors to be the total taxable value of land and additions on the property. | Land | Improvement |
|---|---|---|---|---|
| 2025 | $20,039 | $1,582,620 | $1,067,643 | $514,977 |
| 2024 | $20,039 | $1,551,589 | $1,046,709 | $504,880 |
| 2023 | $19,865 | $1,521,167 | $1,026,186 | $494,981 |
| 2022 | $19,498 | $1,491,341 | $1,006,065 | $485,276 |
| 2021 | $19,220 | $1,462,100 | $986,339 | $475,761 |
| 2020 | $18,941 | $1,447,109 | $976,226 | $470,883 |
| 2019 | $18,192 | $1,418,735 | $957,085 | $461,650 |
| 2018 | $17,837 | $1,390,918 | $938,319 | $452,599 |
| 2017 | $17,599 | $1,363,646 | $919,921 | $443,725 |
| 2016 | $16,644 | $1,336,909 | $901,884 | $435,025 |
| 2015 | $16,492 | $1,316,828 | $888,337 | $428,491 |
| 2014 | $16,102 | $1,291,034 | $870,936 | $420,098 |
Source: Public Records
Map
Nearby Homes
- 11315 Cottonwood Place Unit 39-09 Plan 3
- 10750 Elm Cir Unit 88-17 Plan 2
- 11010 Maple Place Unit 25-06 Plan 4
- 10730 Elm Cir Unit 86-17 Plan 2
- Plan 2 at The Elms
- Plan 3 at The Elms
- Plan 4 at The Elms
- 11210 Cottonwood Place Unit 35-08 Plan 4
- 11645 Redwood Place Unit 56-12 Plan 4
- 11220 Cottonwood Place Unit 36-08 Plan 2
- 11240 Cottonwood Place Unit 38-08 Plan 3
- 11115 Maple Place Unit 30-07
- 11125 Maple Place Unit 31-07 Plan 2
- 11145 Maple Place Unit 33-07 Plan 2
- 11155 Maple Place Unit 34-07 Plan 3
- 11040 Maple Place Unit 28-06 Plan 2
- 11050 Maple Place Unit 29-06 Plan 3
- 10330 Elm Cir Unit 12-03 Plan 2
- 19423 Vineyard Ln
- 12584 Paseo Flores
- 18976 Saratoga Glen Place
- 19000 Saratoga Glen Place
- 18955 Palo Oaks Ct
- 18967 Palo Oaks Ct
- 18983 Saratoga Glen Place
- 18966 Saratoga Glen Place
- 18943 Palo Oaks Ct
- 19020 Saratoga Glen Place
- 18999 Saratoga Glen Place
- 18979 Palo Oaks Ct
- 18967 Saratoga Glen Place
- 19015 Saratoga Glen Place
- 12824 Saratoga Glen Ct
- 12810 Saratoga Glen Ct
- 18931 Palo Oaks Ct
- 18944 Saratoga Glen Place
- 19036 Saratoga Glen Place
- 18951 Saratoga Glen Place
- 18986 Mellon Dr
- 18972 Palo Oaks Ct