19 Caronia St Cranston, RI 02920
Thornton NeighborhoodEstimated Value: $551,161 - $597,000
2
Beds
1
Bath
960
Sq Ft
$600/Sq Ft
Est. Value
About This Home
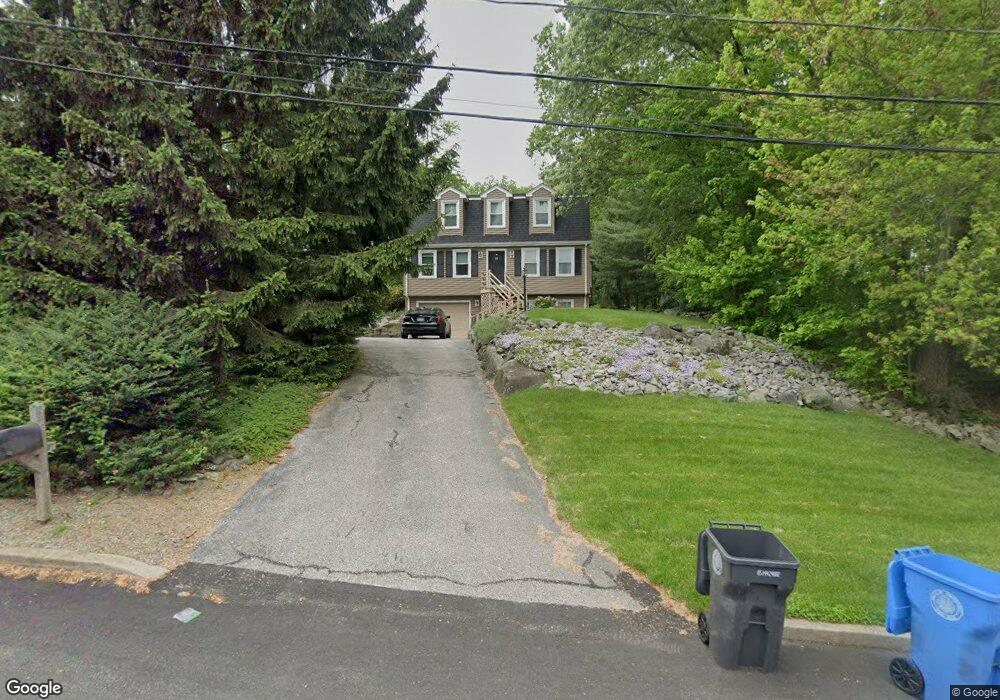
This home is located at 19 Caronia St, Cranston, RI 02920 and is currently estimated at $575,540, approximately $599 per square foot. 19 Caronia St is a home located in Providence County with nearby schools including Stone Hill School, Western Hills Middle School, and Cranston High School West.
Ownership History
Date
Name
Owned For
Owner Type
Purchase Details
Closed on
Apr 22, 2005
Sold by
Mojica Tamie and Dominguez Tannya M
Bought by
Jennings David J and Jennings Brianna L
Current Estimated Value
Home Financials for this Owner
Home Financials are based on the most recent Mortgage that was taken out on this home.
Original Mortgage
$268,000
Interest Rate
5.87%
Mortgage Type
Purchase Money Mortgage
Purchase Details
Closed on
Nov 18, 2002
Sold by
Choboy Jon and Choboy Tammy
Bought by
Mojica Jaime and Dominguez Tammy
Home Financials for this Owner
Home Financials are based on the most recent Mortgage that was taken out on this home.
Original Mortgage
$232,665
Interest Rate
6.03%
Purchase Details
Closed on
Mar 1, 1999
Sold by
Plante Richard W and Plante Lucille
Bought by
Choboy Jon A and Choboy Tammy
Create a Home Valuation Report for This Property
The Home Valuation Report is an in-depth analysis detailing your home's value as well as a comparison with similar homes in the area
Home Values in the Area
Average Home Value in this Area
Purchase History
| Date | Buyer | Sale Price | Title Company |
|---|---|---|---|
| Jennings David J | $335,000 | -- | |
| Mojica Jaime | $245,000 | -- | |
| Choboy Jon A | $156,000 | -- |
Source: Public Records
Mortgage History
| Date | Status | Borrower | Loan Amount |
|---|---|---|---|
| Open | Choboy Jon A | $230,918 | |
| Closed | Choboy Jon A | $268,000 | |
| Closed | Choboy Jon A | $50,250 | |
| Previous Owner | Choboy Jon A | $232,665 |
Source: Public Records
Tax History Compared to Growth
Tax History
| Year | Tax Paid | Tax Assessment Tax Assessment Total Assessment is a certain percentage of the fair market value that is determined by local assessors to be the total taxable value of land and additions on the property. | Land | Improvement |
|---|---|---|---|---|
| 2025 | $6,290 | $453,200 | $166,800 | $286,400 |
| 2024 | $6,168 | $453,200 | $166,800 | $286,400 |
| 2023 | $6,105 | $323,000 | $119,300 | $203,700 |
| 2022 | $5,979 | $323,000 | $119,300 | $203,700 |
| 2021 | $5,814 | $323,000 | $119,300 | $203,700 |
| 2020 | $5,863 | $282,300 | $119,300 | $163,000 |
| 2019 | $5,863 | $282,300 | $119,300 | $163,000 |
| 2018 | $5,728 | $282,300 | $119,300 | $163,000 |
| 2017 | $5,955 | $259,600 | $102,200 | $157,400 |
| 2016 | $5,828 | $259,600 | $102,200 | $157,400 |
| 2015 | $5,828 | $259,600 | $102,200 | $157,400 |
| 2014 | $5,854 | $256,300 | $98,000 | $158,300 |
Source: Public Records
Map
Nearby Homes