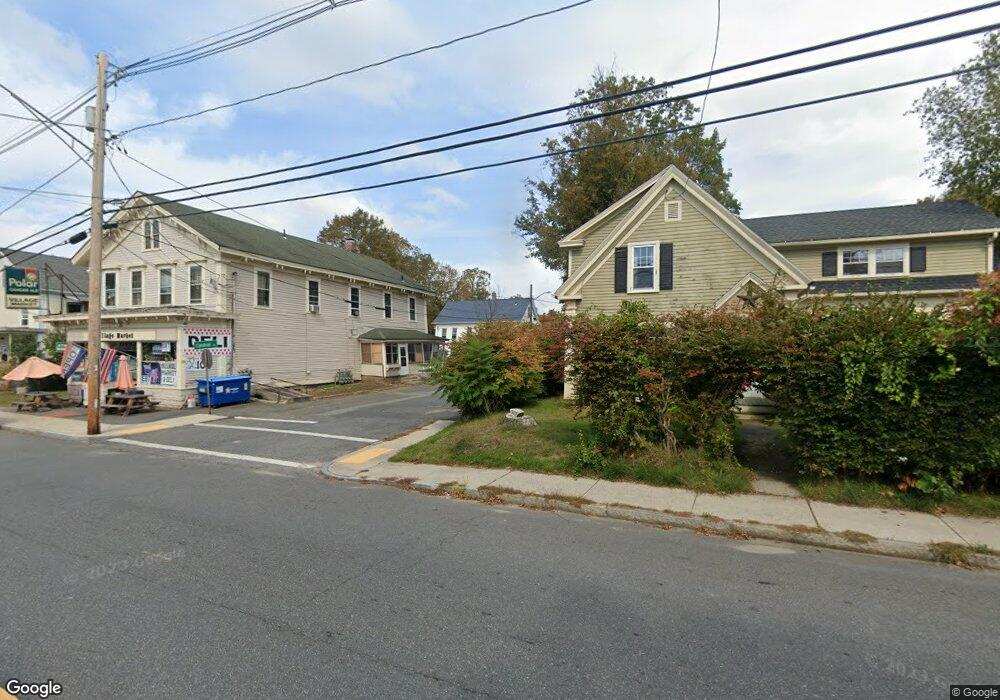
19 Central St West Warren, MA 01092
Estimated Value: $183,000 - $339,000
4
Beds
2
Baths
1,924
Sq Ft
$133/Sq Ft
Est. Value
About This Home
This home is located at 19 Central St, West Warren, MA 01092 and is currently estimated at $255,612, approximately $132 per square foot. 19 Central St is a home with nearby schools including Quaboag Regional High School.
Ownership History
Date
Name
Owned For
Owner Type
Purchase Details
Closed on
Dec 28, 2011
Sold by
Misiaszek
Bought by
Aliengena John J and Aliengena Katrina L
Current Estimated Value
Home Financials for this Owner
Home Financials are based on the most recent Mortgage that was taken out on this home.
Original Mortgage
$60,000
Outstanding Balance
$40,875
Interest Rate
4%
Mortgage Type
Purchase Money Mortgage
Estimated Equity
$214,737
Purchase Details
Closed on
Aug 13, 2009
Sold by
Misiaszek Sallyann T and Misiaszek Witold
Bought by
Misiaszek Sallyann T and Conrad Annemarie
Create a Home Valuation Report for This Property
The Home Valuation Report is an in-depth analysis detailing your home's value as well as a comparison with similar homes in the area
Home Values in the Area
Average Home Value in this Area
Purchase History
| Date | Buyer | Sale Price | Title Company |
|---|---|---|---|
| Aliengena John J | $60,000 | -- | |
| Misiaszek Sallyann T | -- | -- | |
| Misiaszek Sallyann T | -- | -- |
Source: Public Records
Mortgage History
| Date | Status | Borrower | Loan Amount |
|---|---|---|---|
| Open | Aliengena John J | $60,000 | |
| Closed | Misiaszek Sallyann T | $60,000 |
Source: Public Records
Tax History Compared to Growth
Tax History
| Year | Tax Paid | Tax Assessment Tax Assessment Total Assessment is a certain percentage of the fair market value that is determined by local assessors to be the total taxable value of land and additions on the property. | Land | Improvement |
|---|---|---|---|---|
| 2025 | $2,682 | $181,100 | $40,800 | $140,300 |
| 2024 | $2,729 | $181,100 | $40,800 | $140,300 |
| 2023 | $2,672 | $169,100 | $40,800 | $128,300 |
| 2022 | $2,357 | $151,500 | $35,200 | $116,300 |
| 2021 | $2,263 | $141,800 | $33,200 | $108,600 |
| 2020 | $2,296 | $133,800 | $33,200 | $100,600 |
| 2019 | $2,310 | $127,300 | $33,200 | $94,100 |
| 2018 | $2,137 | $123,400 | $33,200 | $90,200 |
| 2017 | $2,220 | $119,600 | $34,500 | $85,100 |
| 2016 | $2,274 | $114,600 | $32,900 | $81,700 |
| 2015 | $2,149 | $114,600 | $32,900 | $81,700 |
| 2014 | $2,189 | $114,600 | $32,900 | $81,700 |
Source: Public Records
Map
Nearby Homes