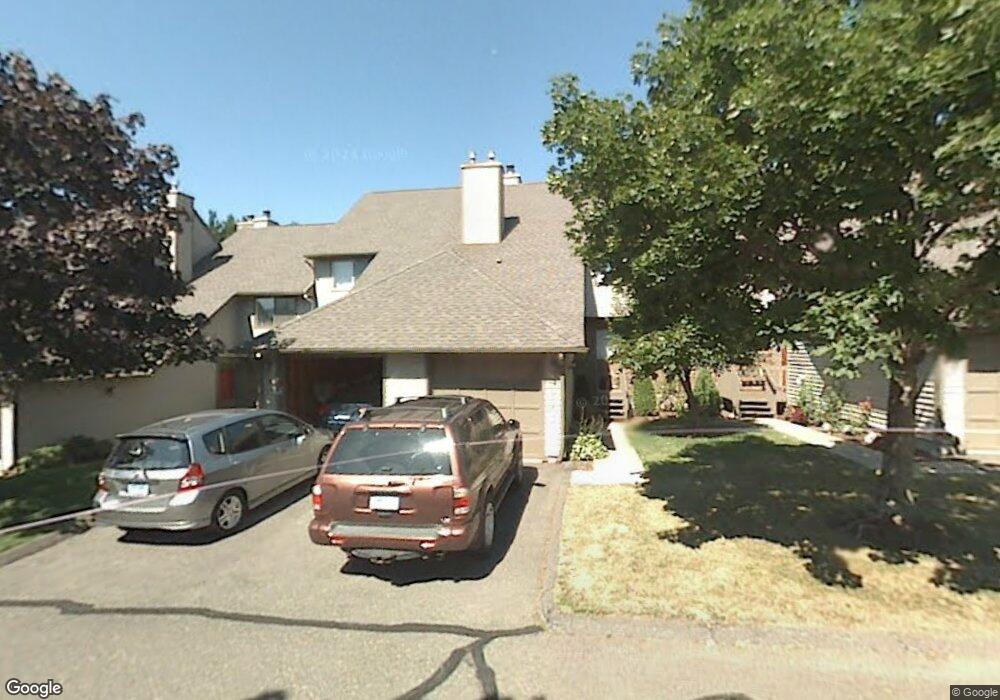
19 Fox Run Ct Newington, CT 06111
Estimated Value: $323,873 - $351,000
2
Beds
3
Baths
1,412
Sq Ft
$240/Sq Ft
Est. Value
About This Home
This home is located at 19 Fox Run Ct, Newington, CT 06111 and is currently estimated at $338,718, approximately $239 per square foot. 19 Fox Run Ct is a home located in Hartford County with nearby schools including John Paterson School, John Wallace Middle School, and Newington High School.
Ownership History
Date
Name
Owned For
Owner Type
Purchase Details
Closed on
Sep 27, 2021
Sold by
Lemay Laura M and Lemay Steven R
Bought by
Falcon Kristen R
Current Estimated Value
Purchase Details
Closed on
Jul 26, 2011
Sold by
Webster Demetriah L
Bought by
Boloz Wendy A
Home Financials for this Owner
Home Financials are based on the most recent Mortgage that was taken out on this home.
Original Mortgage
$199,750
Interest Rate
4.37%
Mortgage Type
FHA
Purchase Details
Closed on
Mar 10, 2006
Sold by
Lehmann Timothy J and Lehmann Dianne P
Bought by
Webster Demetriah L
Home Financials for this Owner
Home Financials are based on the most recent Mortgage that was taken out on this home.
Original Mortgage
$175,000
Interest Rate
6.15%
Purchase Details
Closed on
Oct 16, 1992
Sold by
Halski Chris
Bought by
Figgie International
Create a Home Valuation Report for This Property
The Home Valuation Report is an in-depth analysis detailing your home's value as well as a comparison with similar homes in the area
Home Values in the Area
Average Home Value in this Area
Purchase History
| Date | Buyer | Sale Price | Title Company |
|---|---|---|---|
| Falcon Kristen R | $222,500 | None Available | |
| Boloz Wendy A | $205,000 | -- | |
| Webster Demetriah L | $219,900 | -- | |
| Figgie International | $154,500 | -- |
Source: Public Records
Mortgage History
| Date | Status | Borrower | Loan Amount |
|---|---|---|---|
| Previous Owner | Figgie International | $199,750 | |
| Previous Owner | Figgie International | $177,000 | |
| Previous Owner | Figgie International | $175,000 | |
| Previous Owner | Figgie International | $32,985 |
Source: Public Records
Tax History Compared to Growth
Tax History
| Year | Tax Paid | Tax Assessment Tax Assessment Total Assessment is a certain percentage of the fair market value that is determined by local assessors to be the total taxable value of land and additions on the property. | Land | Improvement |
|---|---|---|---|---|
| 2025 | $5,281 | $132,100 | $0 | $132,100 |
| 2024 | $5,003 | $126,110 | $0 | $126,110 |
| 2023 | $4,838 | $126,110 | $0 | $126,110 |
| 2022 | $4,854 | $126,110 | $0 | $126,110 |
| 2021 | $4,894 | $126,110 | $0 | $126,110 |
| 2020 | $5,206 | $132,530 | $0 | $132,530 |
| 2019 | $5,228 | $132,530 | $0 | $132,530 |
| 2018 | $5,102 | $132,530 | $0 | $132,530 |
| 2017 | $4,849 | $132,530 | $0 | $132,530 |
| 2016 | $4,738 | $132,530 | $0 | $132,530 |
| 2014 | $4,263 | $122,600 | $0 | $122,600 |
Source: Public Records
Map
Nearby Homes
- 120 Fox Run Ct
- 43 Steeplechase Dr Unit 43
- 38 Robin Brook Dr
- 129 Glenview Dr
- 2950 Berlin Turnpike
- 2990 Berlin Turnpike
- 25 Pebble Ct
- 35 Woodsedge Dr Unit 4C
- 133 Robbins Ave
- 15 Woodsedge Dr Unit 6C
- 15 Woodsedge Dr Unit 4B
- 98 Crown Ridge
- 263 Robbins Ave
- 20 Mulberry Ct
- 64 Kenlock St
- 17 Mulberry Ct
- 340 Robbins Ave
- 53 Salem Dr
- 11 Eleanor Place
- 92 Timothy St
- 19 Fox Run Ct Unit 19
- 23 Fox Run Ct
- 15 Fox Run Ct
- 11 Fox Run Ct
- 31 Fox Run Ct
- 27 Fox Run Ct
- 27 Fox Run Ct Unit 27
- 26 Fox Run Ct
- 26 Fox Run Ct Unit 26
- 39 Fox Run Ct
- 7 Fox Run Ct
- 41 Fox Run Ct
- 45 Fox Run Ct
- 198 Hunters Ln
- 198 Hunters Ln Unit 198
- 194 Hunters Ln
- 202 Hunters Ln
- 49 Fox Run Ct
- 33 Fox Run Ct
- 33 Fox Run Ct Unit 33