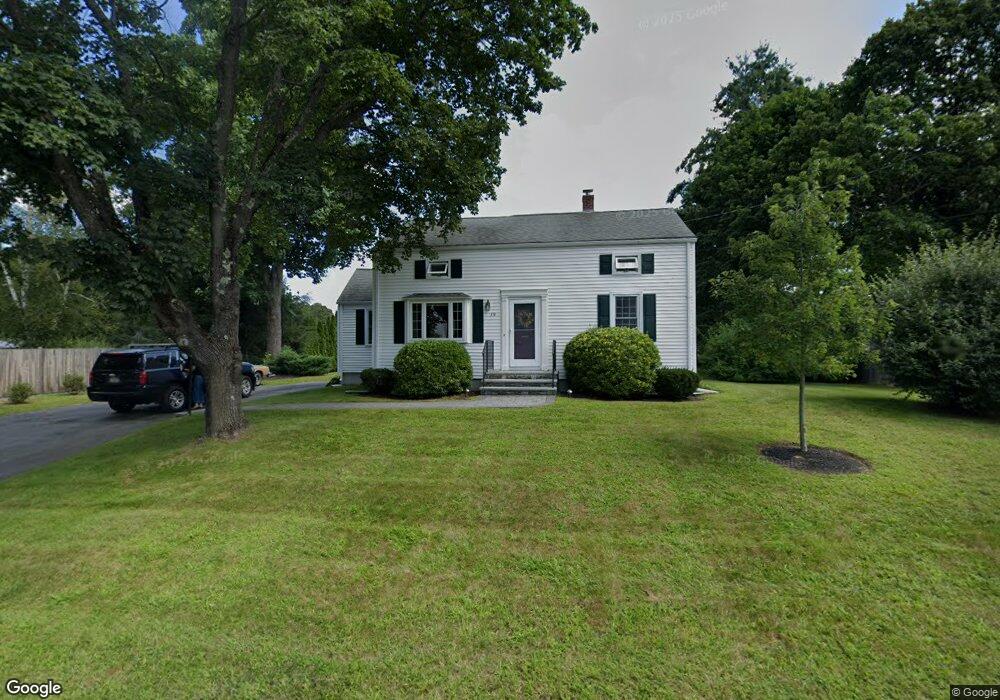
19 Hoover Rd Northborough, MA 01532
Estimated Value: $554,000 - $659,000
3
Beds
2
Baths
1,464
Sq Ft
$413/Sq Ft
Est. Value
About This Home
This home is located at 19 Hoover Rd, Northborough, MA 01532 and is currently estimated at $605,295, approximately $413 per square foot. 19 Hoover Rd is a home located in Worcester County with nearby schools including Fannie E. Proctor Elementary School, Robert E. Melican Middle School, and Algonquin Regional High School.
Ownership History
Date
Name
Owned For
Owner Type
Purchase Details
Closed on
Jul 12, 1996
Sold by
Est Lichwell John Jr and Lichwell Joseph
Bought by
Cataldo Christine
Current Estimated Value
Home Financials for this Owner
Home Financials are based on the most recent Mortgage that was taken out on this home.
Original Mortgage
$105,000
Outstanding Balance
$7,416
Interest Rate
7.98%
Mortgage Type
Purchase Money Mortgage
Estimated Equity
$597,879
Create a Home Valuation Report for This Property
The Home Valuation Report is an in-depth analysis detailing your home's value as well as a comparison with similar homes in the area
Home Values in the Area
Average Home Value in this Area
Purchase History
| Date | Buyer | Sale Price | Title Company |
|---|---|---|---|
| Cataldo Christine | $150,000 | -- |
Source: Public Records
Mortgage History
| Date | Status | Borrower | Loan Amount |
|---|---|---|---|
| Open | Cataldo Christine | $25,000 | |
| Closed | Cataldo Christine | $20,000 | |
| Open | Cataldo Christine | $105,000 | |
| Previous Owner | Cataldo Christine | $80,000 |
Source: Public Records
Tax History Compared to Growth
Tax History
| Year | Tax Paid | Tax Assessment Tax Assessment Total Assessment is a certain percentage of the fair market value that is determined by local assessors to be the total taxable value of land and additions on the property. | Land | Improvement |
|---|---|---|---|---|
| 2025 | $7,397 | $519,100 | $259,400 | $259,700 |
| 2024 | $6,273 | $439,300 | $215,100 | $224,200 |
| 2023 | $6,167 | $417,000 | $203,000 | $214,000 |
| 2022 | $6,016 | $364,800 | $193,300 | $171,500 |
| 2021 | $5,744 | $335,500 | $175,600 | $159,900 |
| 2020 | $5,768 | $334,400 | $175,600 | $158,800 |
| 2019 | $5,287 | $308,300 | $170,300 | $138,000 |
| 2018 | $5,116 | $294,200 | $166,600 | $127,600 |
| 2017 | $4,923 | $283,100 | $166,600 | $116,500 |
| 2016 | $4,701 | $273,800 | $163,200 | $110,600 |
| 2015 | $4,462 | $266,700 | $166,000 | $100,700 |
| 2014 | $4,237 | $255,400 | $166,000 | $89,400 |
Source: Public Records
Map
Nearby Homes
- 1 Hamilton Rd
- 139 Davis St
- 12 Saddle Hill Dr
- 223 South St
- 198 South St
- 59 Indian Meadow Dr
- 185-187 South St
- 11 Hillside Rd
- 349 Brigham St
- 22 Hitching Post Ln
- 19 Crestwood Dr Unit 19
- 132 W Main St
- 71 Summer St
- 89 W Main St
- 105 Lincoln St
- 90 W Main St
- 59 School St Unit A-14
- 5 Swan View Common Dr
- 39 Pleasant St Unit B19
- 39 Pleasant St Unit C5