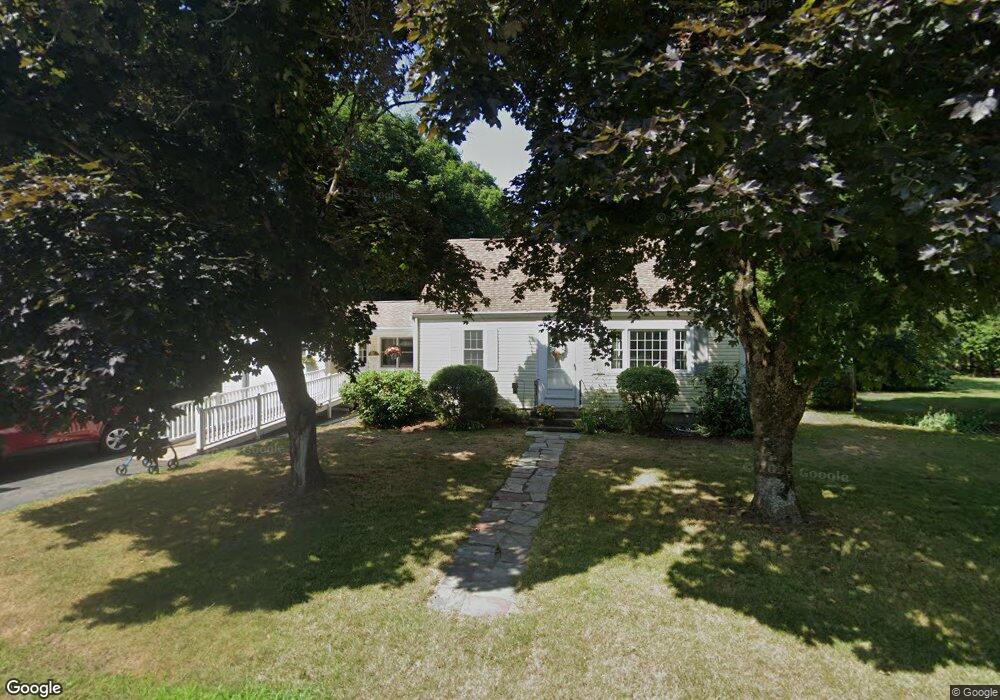
19 Merigan Way Foxboro, MA 02035
Estimated Value: $621,000 - $645,000
3
Beds
2
Baths
1,684
Sq Ft
$375/Sq Ft
Est. Value
About This Home
This home is located at 19 Merigan Way, Foxboro, MA 02035 and is currently estimated at $630,661, approximately $374 per square foot. 19 Merigan Way is a home located in Norfolk County with nearby schools including Foxborough High School, Foxborough Regional Charter School, and Hands-On-Montessori School.
Ownership History
Date
Name
Owned For
Owner Type
Purchase Details
Closed on
Dec 31, 2012
Sold by
Kerrigan William S and Kerrigan Geraldine H
Bought by
Kerrigan Ft
Current Estimated Value
Purchase Details
Closed on
Sep 17, 1973
Bought by
Kerrigan Michael B and Kerrigan Kevin W
Create a Home Valuation Report for This Property
The Home Valuation Report is an in-depth analysis detailing your home's value as well as a comparison with similar homes in the area
Home Values in the Area
Average Home Value in this Area
Purchase History
| Date | Buyer | Sale Price | Title Company |
|---|---|---|---|
| Kerrigan Ft | -- | -- | |
| Kerrigan Michael B | -- | -- |
Source: Public Records
Mortgage History
| Date | Status | Borrower | Loan Amount |
|---|---|---|---|
| Previous Owner | Kerrigan Michael B | $70,000 | |
| Previous Owner | Kerrigan Michael B | $50,000 | |
| Previous Owner | Kerrigan Michael B | $35,000 |
Source: Public Records
Tax History Compared to Growth
Tax History
| Year | Tax Paid | Tax Assessment Tax Assessment Total Assessment is a certain percentage of the fair market value that is determined by local assessors to be the total taxable value of land and additions on the property. | Land | Improvement |
|---|---|---|---|---|
| 2025 | $6,721 | $508,400 | $218,700 | $289,700 |
| 2024 | $6,452 | $477,600 | $218,700 | $258,900 |
| 2023 | $6,272 | $441,400 | $208,200 | $233,200 |
| 2022 | $6,111 | $420,900 | $199,200 | $221,700 |
| 2021 | $5,757 | $390,600 | $181,100 | $209,500 |
| 2020 | $5,567 | $382,100 | $181,100 | $201,000 |
| 2019 | $5,288 | $359,700 | $172,400 | $187,300 |
| 2018 | $5,191 | $356,300 | $172,400 | $183,900 |
| 2017 | $4,882 | $324,600 | $161,200 | $163,400 |
| 2016 | $4,902 | $330,800 | $155,100 | $175,700 |
| 2015 | $4,657 | $306,600 | $130,900 | $175,700 |
| 2014 | $4,558 | $304,100 | $128,400 | $175,700 |
Source: Public Records
Map
Nearby Homes
- 12 Spring St
- 356 Central St
- 619 N Main St
- 42 Angell St
- 44 Angell St Unit 44
- 28 Angell St
- 166 Chauncy St
- 11 W Belcher Rd Unit 2
- 22 Pleasant St Unit C
- 18 Winter St Unit E
- 14 Winter St Unit B
- 450 West St
- 82 Brook St
- 84 Cocasset St Unit A6
- 28 Court St
- 16 East St Unit 2
- 24 Mechanic St
- 14 Baker St
- 231 Spring St
- 11 Orchard Place Unit 11