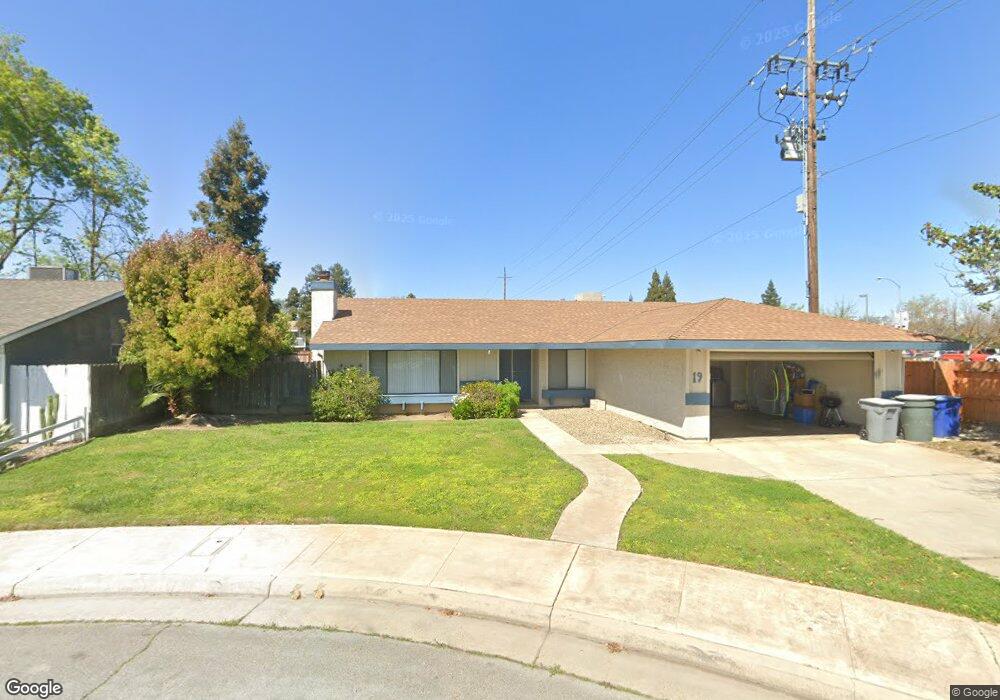
19 Sun Valley Ct Merced, CA 95348
North Merced NeighborhoodEstimated Value: $392,090 - $423,000
3
Beds
2
Baths
1,577
Sq Ft
$260/Sq Ft
Est. Value
About This Home
This home is located at 19 Sun Valley Ct, Merced, CA 95348 and is currently estimated at $409,523, approximately $259 per square foot. 19 Sun Valley Ct is a home located in Merced County with nearby schools including Allan Peterson Elementary School, Herbert H. Cruickshank Middle School, and Merced High School.
Ownership History
Date
Name
Owned For
Owner Type
Purchase Details
Closed on
Jul 28, 2005
Sold by
Min Thomas K and Kim Jung Y
Bought by
Flores Andres E and Flores Patsy L
Current Estimated Value
Purchase Details
Closed on
Jun 12, 2003
Sold by
Whittaker Matthew T and Whittaker Tiffany N
Bought by
Min Thomas K and Kim Jung Y
Home Financials for this Owner
Home Financials are based on the most recent Mortgage that was taken out on this home.
Original Mortgage
$156,750
Interest Rate
3.87%
Mortgage Type
Purchase Money Mortgage
Purchase Details
Closed on
Jul 19, 2001
Sold by
Gutierrez Jamie Schrole
Bought by
Whittaker Matthew T and Whittaker Tiffany N
Home Financials for this Owner
Home Financials are based on the most recent Mortgage that was taken out on this home.
Original Mortgage
$144,400
Interest Rate
7.15%
Create a Home Valuation Report for This Property
The Home Valuation Report is an in-depth analysis detailing your home's value as well as a comparison with similar homes in the area
Home Values in the Area
Average Home Value in this Area
Purchase History
| Date | Buyer | Sale Price | Title Company |
|---|---|---|---|
| Flores Andres E | $359,000 | Transcounty Title Company | |
| Min Thomas K | $209,000 | Transcounty Title Company | |
| Whittaker Matthew T | $152,000 | Fidelity National Title Co |
Source: Public Records
Mortgage History
| Date | Status | Borrower | Loan Amount |
|---|---|---|---|
| Previous Owner | Min Thomas K | $156,750 | |
| Previous Owner | Whittaker Matthew T | $144,400 | |
| Closed | Min Thomas K | $41,800 |
Source: Public Records
Tax History Compared to Growth
Tax History
| Year | Tax Paid | Tax Assessment Tax Assessment Total Assessment is a certain percentage of the fair market value that is determined by local assessors to be the total taxable value of land and additions on the property. | Land | Improvement |
|---|---|---|---|---|
| 2025 | $4,024 | $379,500 | $120,000 | $259,500 |
| 2024 | $4,024 | $375,500 | $120,000 | $255,500 |
| 2023 | $3,951 | $366,500 | $105,000 | $261,500 |
| 2022 | $3,598 | $331,500 | $85,000 | $246,500 |
| 2021 | $3,150 | $285,000 | $85,000 | $200,000 |
| 2020 | $2,927 | $260,000 | $80,000 | $180,000 |
| 2019 | $2,812 | $248,500 | $65,000 | $183,500 |
| 2018 | $2,501 | $237,500 | $55,000 | $182,500 |
| 2017 | $2,503 | $224,500 | $45,000 | $179,500 |
| 2016 | $2,206 | $197,000 | $45,000 | $152,000 |
| 2015 | $2,293 | $205,000 | $45,000 | $160,000 |
| 2014 | $1,910 | $171,000 | $30,000 | $141,000 |
Source: Public Records
Map
Nearby Homes
- 309 Silver Star Ct
- 3482 Arch Rock St
- 3514 Oakhurst Ave
- 310 Buena Vista Ct
- 413 El Portal Ct
- 3536 Trinity Ct
- 3584 Gateway Place
- 3315 Line Dr
- 935 Doe Ct
- 992 Gazelle Ct E
- 997 Gazelle Ct
- 693 Bobwhite Ct
- 1046 Century Dr
- 3640 Syracuse Ct
- 3367 M St
- 3334 El Capitan Ct
- 3375 De Anza Ct
- 3937 Finch Ct
- 749 Junipero Ct
- 3320 Cherokee Ave
- 39 Sun Valley Ct
- 14 Silverhorn Ct
- 4 Silverhorn Ct
- 24 Silverhorn Ct
- 59 Sun Valley Ct
- 8 Sun Valley Ct
- 28 Sun Valley Ct
- 44 Silverhorn Ct
- 48 Sun Valley Ct
- 79 Sun Valley Ct
- 64 Silverhorn Ct
- 17 W Donna Dr
- 68 Sun Valley Ct
- 37 W Donna Dr
- 99 Sun Valley Ct
- 57 W Donna Dr
- 88 Sun Valley Ct
- 77 E Donna Dr
- 3522 G St
- 3522 G St Unit 2