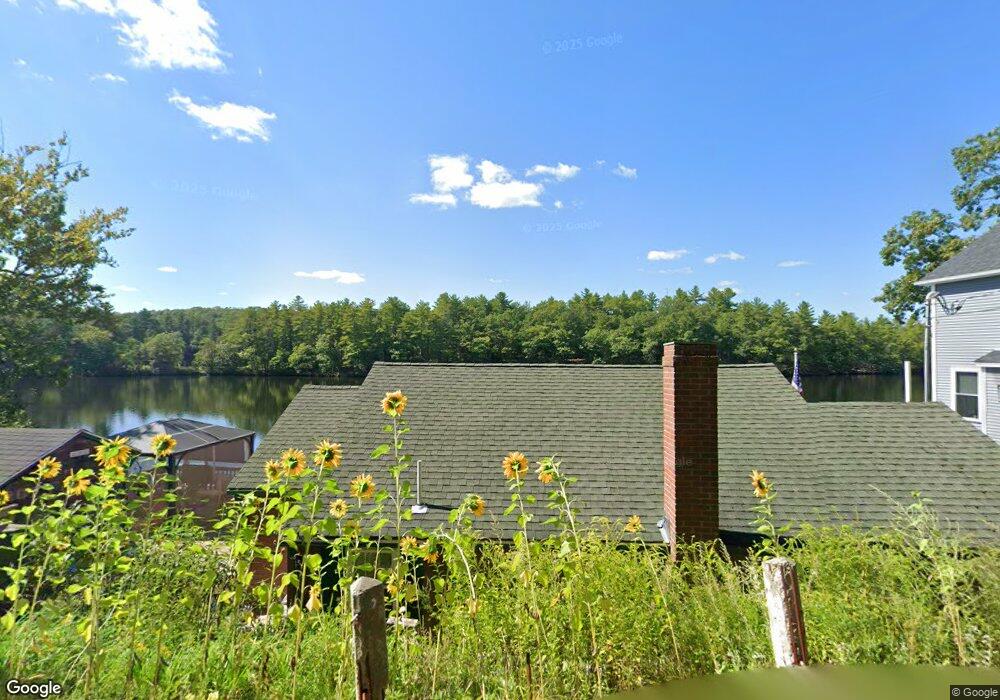
190 Massapoag Rd Unit 2 Tyngsboro, MA 01879
Estimated Value: $429,000 - $614,000
1
Bed
1
Bath
350
Sq Ft
$1,526/Sq Ft
Est. Value
About This Home
This home is located at 190 Massapoag Rd Unit 2, Tyngsboro, MA 01879 and is currently estimated at $534,132, approximately $1,526 per square foot. 190 Massapoag Rd Unit 2 is a home located in Middlesex County with nearby schools including Tyngsborough Elementary School and Tyngsborough Middle School.
Ownership History
Date
Name
Owned For
Owner Type
Purchase Details
Closed on
Apr 30, 2001
Sold by
Boyle Scott and Boyle Doria
Bought by
Annese Marc R
Current Estimated Value
Home Financials for this Owner
Home Financials are based on the most recent Mortgage that was taken out on this home.
Original Mortgage
$137,750
Outstanding Balance
$50,864
Interest Rate
6.88%
Mortgage Type
Purchase Money Mortgage
Estimated Equity
$483,268
Purchase Details
Closed on
Sep 2, 1998
Sold by
Fnma
Bought by
Boyle Scott and Boyle Doria
Home Financials for this Owner
Home Financials are based on the most recent Mortgage that was taken out on this home.
Original Mortgage
$76,050
Interest Rate
6.9%
Mortgage Type
Purchase Money Mortgage
Purchase Details
Closed on
May 23, 1996
Sold by
Mckay Frederick and Fidelity Sb
Bought by
Fidelity Sb
Purchase Details
Closed on
Sep 15, 1987
Sold by
Lamorre Michael D
Bought by
Mckay Frederick P
Home Financials for this Owner
Home Financials are based on the most recent Mortgage that was taken out on this home.
Original Mortgage
$85,000
Interest Rate
10.27%
Mortgage Type
Purchase Money Mortgage
Create a Home Valuation Report for This Property
The Home Valuation Report is an in-depth analysis detailing your home's value as well as a comparison with similar homes in the area
Home Values in the Area
Average Home Value in this Area
Purchase History
| Date | Buyer | Sale Price | Title Company |
|---|---|---|---|
| Annese Marc R | $145,000 | -- | |
| Boyle Scott | $84,500 | -- | |
| Fidelity Sb | $112,909 | -- | |
| Mckay Frederick P | $95,000 | -- |
Source: Public Records
Mortgage History
| Date | Status | Borrower | Loan Amount |
|---|---|---|---|
| Open | Mckay Frederick P | $137,750 | |
| Previous Owner | Mckay Frederick P | $76,050 | |
| Previous Owner | Mckay Frederick P | $85,000 |
Source: Public Records
Tax History Compared to Growth
Tax History
| Year | Tax Paid | Tax Assessment Tax Assessment Total Assessment is a certain percentage of the fair market value that is determined by local assessors to be the total taxable value of land and additions on the property. | Land | Improvement |
|---|---|---|---|---|
| 2025 | $52 | $418,900 | $198,100 | $220,800 |
| 2024 | $4,813 | $378,400 | $180,200 | $198,200 |
| 2023 | $5,078 | $359,100 | $180,200 | $178,900 |
| 2022 | $4,847 | $324,400 | $157,500 | $166,900 |
| 2021 | $4,569 | $295,400 | $142,900 | $152,500 |
| 2020 | $4,600 | $283,100 | $142,900 | $140,200 |
| 2019 | $4,490 | $265,200 | $133,100 | $132,100 |
| 2018 | $8,284 | $262,600 | $133,100 | $129,500 |
| 2017 | $4,244 | $247,300 | $133,100 | $114,200 |
| 2016 | $4,178 | $237,900 | $133,100 | $104,800 |
| 2015 | $3,923 | $231,300 | $126,500 | $104,800 |
Source: Public Records
Map
Nearby Homes
- 660 Old Dunstable Rd
- 2 Wildflower Ln
- 153 Off Pond St
- 446 Westford St
- 0 Old Dunstable Rd
- 18 Ingalls Rd
- 6 Ingalls Rd
- 319 Pleasant St
- 11 Old Hickory Rd
- 1 Summer Village Rd
- 8 Jamie Rd
- 45 Red Gate Rd
- 21 Heritage Ln
- 19 Sandstone Rd
- 8 Hammock Dr Unit 8
- 15 Stone Ridge Rd
- 78 Dunstable Rd
- 20 Highland Rd
- 35 Keyes Rd
- 22 Highland Rd
- 190 Massapoag Rd
- 194 Massapoag Rd
- 198 Massapoag Rd
- 186 Massapoag Rd
- 182 Massapoag Rd
- 202 Massapoag Rd
- 206 Massapoag Rd
- 176 Massapoag Rd
- 210 Massapoag Rd
- 172 Massapoag Rd
- 212 Massapoag Rd
- 214 Massapoag Rd
- 170 Massapoag Rd
- 220 Massapoag Rd
- 222 Massapoag Rd
- 0 Geraldine Place
- 158 Massapoag Rd
- 156 Massapoag Rd
- 67 Island Pond Rd
- 67 Island Pond Rd