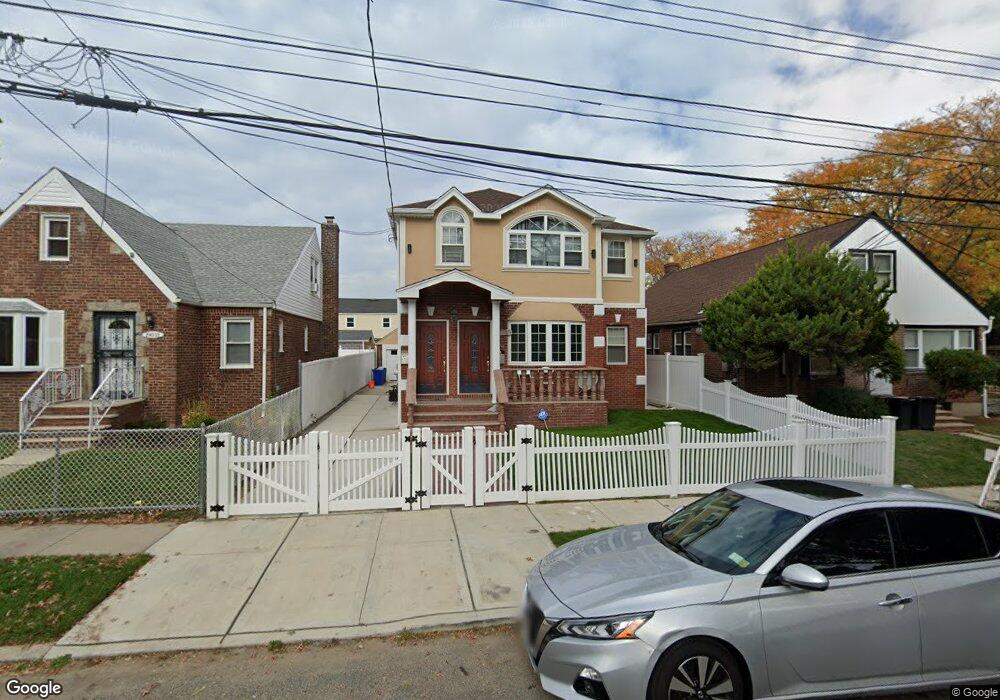
19015 121st Ave Saint Albans, NY 11412
Saint Albans NeighborhoodEstimated Value: $767,856 - $1,161,000
--
Bed
--
Bath
2,106
Sq Ft
$475/Sq Ft
Est. Value
About This Home
This home is located at 19015 121st Ave, Saint Albans, NY 11412 and is currently estimated at $1,000,964, approximately $475 per square foot. 19015 121st Ave is a home located in Queens County with nearby schools including P.S. 15 Jackie Robinson, Is 59 Springfield Gardens, and Success Academy Springfield Gardens.
Ownership History
Date
Name
Owned For
Owner Type
Purchase Details
Closed on
Feb 22, 2021
Sold by
1429 Pitkin Ave Inc
Bought by
Jalloh Abubakar and Jalloh Isatu Bella
Current Estimated Value
Home Financials for this Owner
Home Financials are based on the most recent Mortgage that was taken out on this home.
Original Mortgage
$952,125
Outstanding Balance
$851,571
Interest Rate
2.7%
Mortgage Type
Purchase Money Mortgage
Estimated Equity
$149,393
Purchase Details
Closed on
Oct 13, 2017
Sold by
Supreme Investing Corp
Bought by
1429 Pitkin Ave Inc
Purchase Details
Closed on
Jul 7, 2017
Sold by
Howell Ernest A and Washington Howell Fern
Bought by
Supreme Investing Corp
Purchase Details
Closed on
May 5, 1995
Sold by
Dash Charlotte M
Bought by
Hanson Norma
Home Financials for this Owner
Home Financials are based on the most recent Mortgage that was taken out on this home.
Original Mortgage
$130,000
Interest Rate
8.34%
Create a Home Valuation Report for This Property
The Home Valuation Report is an in-depth analysis detailing your home's value as well as a comparison with similar homes in the area
Home Values in the Area
Average Home Value in this Area
Purchase History
| Date | Buyer | Sale Price | Title Company |
|---|---|---|---|
| Jalloh Abubakar | $985,000 | -- | |
| 1429 Pitkin Ave Inc | $30,000 | -- | |
| Supreme Investing Corp | -- | -- | |
| Hanson Norma | $137,000 | Long Island Title |
Source: Public Records
Mortgage History
| Date | Status | Borrower | Loan Amount |
|---|---|---|---|
| Open | Jalloh Abubakar | $952,125 | |
| Previous Owner | Hanson Norma | $130,000 |
Source: Public Records
Tax History Compared to Growth
Tax History
| Year | Tax Paid | Tax Assessment Tax Assessment Total Assessment is a certain percentage of the fair market value that is determined by local assessors to be the total taxable value of land and additions on the property. | Land | Improvement |
|---|---|---|---|---|
| 2025 | $8,262 | $42,926 | $12,614 | $30,312 |
| 2024 | $6,256 | $41,136 | $11,355 | $29,781 |
| 2023 | $8,070 | $40,180 | $12,201 | $27,979 |
| 2022 | $5,689 | $56,640 | $16,380 | $40,260 |
| 2021 | $8,087 | $42,900 | $13,020 | $29,880 |
| 2020 | $5,583 | $32,940 | $13,020 | $19,920 |
| 2019 | $5,205 | $28,200 | $13,020 | $15,180 |
| 2018 | $4,910 | $24,087 | $9,555 | $14,532 |
| 2017 | $4,632 | $22,725 | $11,336 | $11,389 |
| 2016 | $4,543 | $22,725 | $11,336 | $11,389 |
| 2015 | $2,366 | $21,979 | $12,983 | $8,996 |
| 2014 | $2,366 | $20,736 | $11,255 | $9,481 |
Source: Public Records
Map
Nearby Homes
- 191-07 121st Ave
- 12133 Grayson St
- 188-51 120th Rd
- 19009 122nd Ave
- 120-44 192nd St
- 191-01 122nd Ave
- 12248 Benton St
- 12251 Grayson St
- 12054 194th St
- 119-44 193rd St
- 120-20 194th St
- 12253 Milburn St
- 18822 119th Ave
- 122-22 Nellis St
- 12043 194th St
- 18806 Nashville Blvd
- 194-09 122nd Ave
- 19115 Williamson Ave
- 12244 Nellis St
- 11915 193rd St
- 190-15 121st Ave
- 19011 121st Ave
- 19019 121st Ave
- 190-19 121st Ave
- 19007 121st Ave
- 18876 120th Rd
- 12032 Lucas St
- 18882 120th Rd
- 19003 121st Ave
- 18872 120th Rd
- 188-82 120th Rd
- 19020 121st Ave
- 18870 120th Rd
- 188-70 120th Rd
- 12041 Lucas St
- 12041 Lucas St
- 190-16 121st Ave
- 190-16 121st Ave Unit 2nd FL
- 19016 121st Ave
- 19016 121st Ave Unit 2nd FL