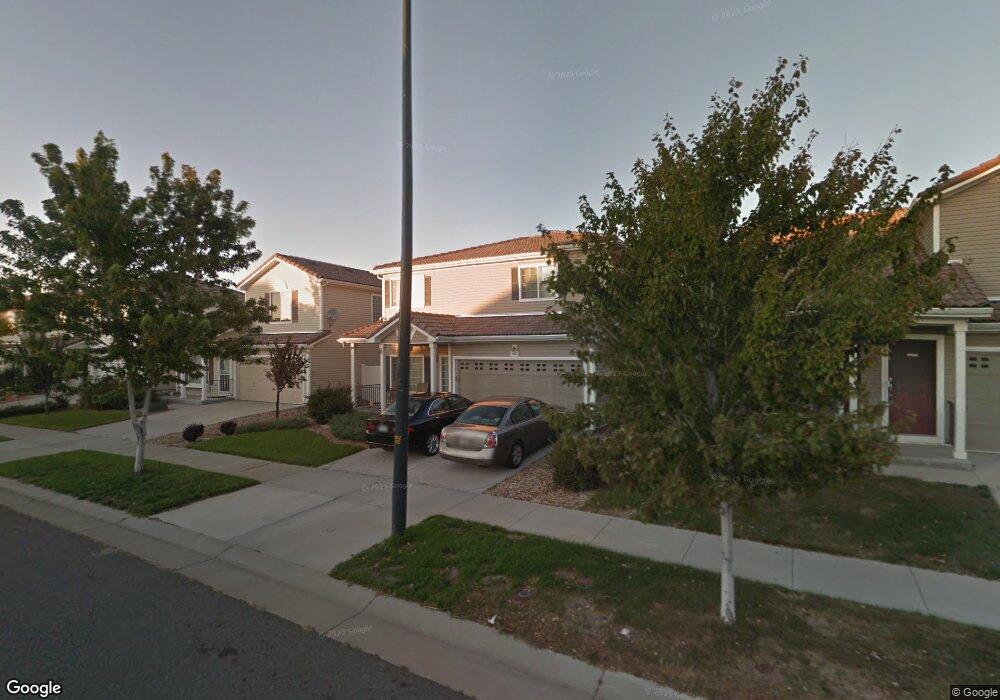
19035 Burlington Place Denver, CO 80249
Green Valley Ranch NeighborhoodEstimated Value: $463,975 - $488,000
3
Beds
3
Baths
1,858
Sq Ft
$256/Sq Ft
Est. Value
About This Home
This home is located at 19035 Burlington Place, Denver, CO 80249 and is currently estimated at $475,494, approximately $255 per square foot. 19035 Burlington Place is a home located in Denver County with nearby schools including Pitt-Waller K-8 School, McGlone Academy, and Marie L. Greenwood Academy.
Ownership History
Date
Name
Owned For
Owner Type
Purchase Details
Closed on
Feb 22, 2019
Sold by
Aquino John and Aquino Carly
Bought by
Rodgers Joseph and Cox Melissa
Current Estimated Value
Home Financials for this Owner
Home Financials are based on the most recent Mortgage that was taken out on this home.
Original Mortgage
$324,022
Interest Rate
5.5%
Mortgage Type
FHA
Purchase Details
Closed on
Mar 2, 2016
Sold by
Dixon Christina L and Dixon Durrell E
Bought by
Aquino John and Aquino Carly
Home Financials for this Owner
Home Financials are based on the most recent Mortgage that was taken out on this home.
Original Mortgage
$270,019
Interest Rate
4.4%
Mortgage Type
FHA
Purchase Details
Closed on
Jul 16, 2004
Sold by
Oakwood Homes Llc
Bought by
Dixon Durrell E and Dixon Christina L
Home Financials for this Owner
Home Financials are based on the most recent Mortgage that was taken out on this home.
Original Mortgage
$199,901
Interest Rate
6.3%
Mortgage Type
FHA
Create a Home Valuation Report for This Property
The Home Valuation Report is an in-depth analysis detailing your home's value as well as a comparison with similar homes in the area
Home Values in the Area
Average Home Value in this Area
Purchase History
| Date | Buyer | Sale Price | Title Company |
|---|---|---|---|
| Rodgers Joseph | $330,000 | None Available | |
| Rodgers Joseph | $330,000 | None Available | |
| Aquino John | $275,000 | Prestige Title & Escrow | |
| Dixon Durrell E | $202,725 | -- |
Source: Public Records
Mortgage History
| Date | Status | Borrower | Loan Amount |
|---|---|---|---|
| Previous Owner | Rodgers Joseph | $324,022 | |
| Previous Owner | Aquino John | $270,019 | |
| Previous Owner | Dixon Durrell E | $199,901 |
Source: Public Records
Tax History Compared to Growth
Tax History
| Year | Tax Paid | Tax Assessment Tax Assessment Total Assessment is a certain percentage of the fair market value that is determined by local assessors to be the total taxable value of land and additions on the property. | Land | Improvement |
|---|---|---|---|---|
| 2024 | $3,808 | $29,760 | $320 | $29,440 |
| 2023 | $3,665 | $29,760 | $320 | $29,440 |
| 2022 | $3,270 | $24,560 | $3,600 | $20,960 |
| 2021 | $3,019 | $25,260 | $3,700 | $21,560 |
| 2020 | $3,274 | $24,710 | $3,700 | $21,010 |
| 2019 | $3,223 | $24,710 | $3,700 | $21,010 |
| 2018 | $2,743 | $20,260 | $2,300 | $17,960 |
| 2017 | $3,404 | $20,260 | $2,300 | $17,960 |
| 2016 | $2,879 | $17,390 | $2,221 | $15,169 |
| 2015 | $2,819 | $17,390 | $2,221 | $15,169 |
| 2014 | $1,777 | $11,240 | $2,388 | $8,852 |
Source: Public Records
Map
Nearby Homes
- 18896 E 51st Place
- 5046 Espana Way
- 5445 Danube St
- 5188 Andes Way
- 19158 E 54th Place
- 5153 Andes Way
- 18619 E 50th Place
- 19118 E 54th Place
- 19147 E 54th Place
- 5131 Andes St
- 19060 E 54th Place
- 5470 Ensenada St
- 19165 E 55th Ave
- 19096 E 55th Ave
- 19664 E 49th Place
- 5038 N Andes St
- 18703 E 54th Ave
- 5521 Ensenada St
- 19051 E 55th Ave
- 18667 E 54th Place
- 19025 Burlington Place
- 19055 Burlington Place
- 19015 Burlington Place
- 19036 E 51st Place
- 19046 E 51st Place
- 19056 E 51st Place
- 19034 Burlington Place
- 19065 Burlington Place
- 19005 Burlington Place
- 19026 E 51st Place
- 19066 E 51st Place
- 19044 Burlington Place
- 19024 Burlington Place
- 19054 Burlington Place
- 19006 E 51st Place
- 19075 Burlington Place
- 19076 E 51st Place
- 19014 Burlington Place
- 19086 E 51st Place
- 19064 Burlington Place