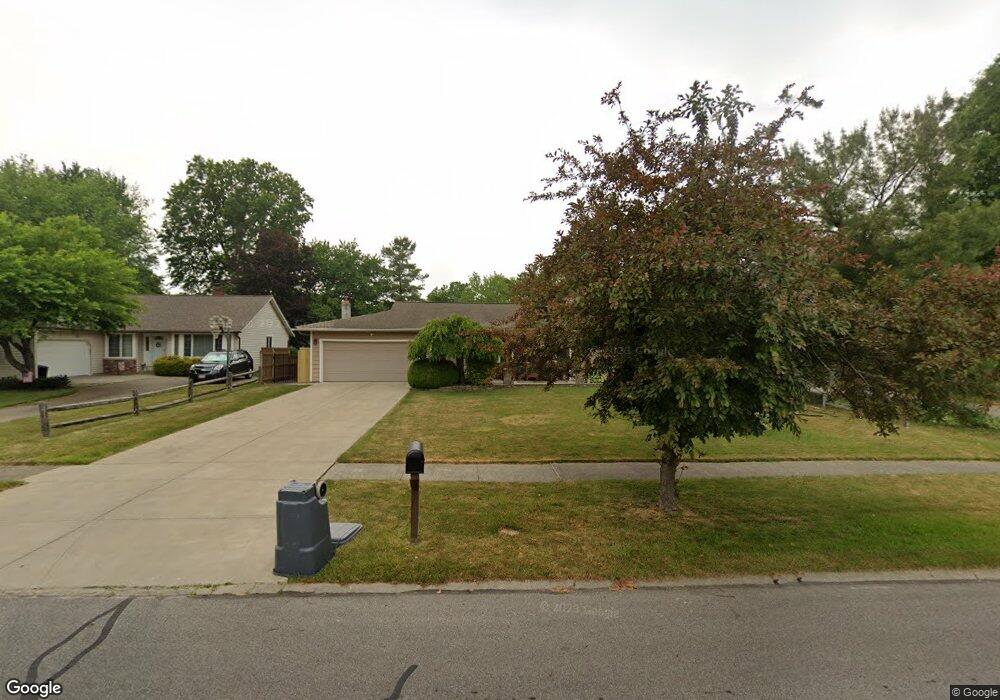
19050 Quail Hollow Dr Strongsville, OH 44136
Estimated Value: $328,646 - $378,000
3
Beds
2
Baths
2,009
Sq Ft
$174/Sq Ft
Est. Value
About This Home
This home is located at 19050 Quail Hollow Dr, Strongsville, OH 44136 and is currently estimated at $348,912, approximately $173 per square foot. 19050 Quail Hollow Dr is a home located in Cuyahoga County with nearby schools including Strongsville High School and Sts Joseph & John Interparochial School.
Ownership History
Date
Name
Owned For
Owner Type
Purchase Details
Closed on
Jun 18, 2004
Sold by
Nicholas John A and Nicholas Peggy A
Bought by
Bucsanyi Zsolt and Bucsanyi Maria
Current Estimated Value
Home Financials for this Owner
Home Financials are based on the most recent Mortgage that was taken out on this home.
Original Mortgage
$130,000
Outstanding Balance
$64,272
Interest Rate
6.17%
Mortgage Type
Purchase Money Mortgage
Estimated Equity
$284,640
Purchase Details
Closed on
May 27, 1994
Sold by
Boytte Frances T and Boytte Amos M
Bought by
Nicholas John A
Purchase Details
Closed on
Oct 15, 1985
Sold by
Martin Mitchell S
Bought by
Boytte Frances T and Boytte Amos M
Purchase Details
Closed on
Jul 11, 1985
Sold by
Washnitzer Robert J
Bought by
Martin Mitchell S
Purchase Details
Closed on
Jun 16, 1978
Sold by
Hines Robert R
Bought by
Washnitzer Robert J
Purchase Details
Closed on
Mar 2, 1976
Bought by
Hines Robert R
Purchase Details
Closed on
Jan 1, 1975
Bought by
Brookfield Homes Inc
Create a Home Valuation Report for This Property
The Home Valuation Report is an in-depth analysis detailing your home's value as well as a comparison with similar homes in the area
Home Values in the Area
Average Home Value in this Area
Purchase History
| Date | Buyer | Sale Price | Title Company |
|---|---|---|---|
| Bucsanyi Zsolt | $178,000 | Millennium | |
| Nicholas John A | $140,000 | -- | |
| Boytte Frances T | $83,000 | -- | |
| Martin Mitchell S | $69,500 | -- | |
| Washnitzer Robert J | $71,500 | -- | |
| Hines Robert R | $57,300 | -- | |
| Brookfield Homes Inc | -- | -- |
Source: Public Records
Mortgage History
| Date | Status | Borrower | Loan Amount |
|---|---|---|---|
| Open | Bucsanyi Zsolt | $130,000 |
Source: Public Records
Tax History Compared to Growth
Tax History
| Year | Tax Paid | Tax Assessment Tax Assessment Total Assessment is a certain percentage of the fair market value that is determined by local assessors to be the total taxable value of land and additions on the property. | Land | Improvement |
|---|---|---|---|---|
| 2024 | $5,208 | $110,915 | $20,125 | $90,790 |
| 2023 | $4,833 | $77,180 | $18,590 | $58,590 |
| 2022 | $4,798 | $77,175 | $18,585 | $58,590 |
| 2021 | $4,760 | $77,180 | $18,590 | $58,590 |
| 2020 | $4,409 | $63,250 | $15,230 | $48,020 |
| 2019 | $4,280 | $180,700 | $43,500 | $137,200 |
| 2018 | $3,884 | $63,250 | $15,230 | $48,020 |
| 2017 | $3,899 | $58,770 | $12,250 | $46,520 |
| 2016 | $3,867 | $58,770 | $12,250 | $46,520 |
| 2015 | $3,922 | $58,770 | $12,250 | $46,520 |
| 2014 | $3,922 | $58,770 | $12,250 | $46,520 |
Source: Public Records
Map
Nearby Homes
- 17159 Turkey Meadow Ln
- 16650 Lanier Ave
- 17024 Bear Creek Ln
- 17682 Drake Rd
- 16486 S Red Rock Dr
- 17130 Golden Star Dr
- 18294 Drake Rd
- 16450 Howe Rd
- 17069 Partridge Dr
- 17934 Cambridge Oval
- 18229 Howe Rd
- 18411 Yorktown Oval
- 18162 Fawn Cir
- 15639 Indianhead Ln
- 16711 Beech Cir
- 17259 Woodshire Dr
- 18630 Shurmer Rd
- 19297 Lauren Way
- 19311 Bradford Ct
- 14826 Lenox Dr
- 19044 Quail Hollow Dr
- 19056 Quail Hollow Dr
- 19038 Quail Hollow Dr
- 19060 Quail Hollow Dr
- 19095 Turkey Meadow Ln
- 19087 Turkey Meadow Ln
- 19101 Turkey Meadow Ln
- 19083 Turkey Meadow Ln
- 19047 Quail Hollow Dr
- 16963 Ringneck Cir
- 19055 Quail Hollow Dr
- 19105 Turkey Meadow Ln
- 19075 Turkey Meadow Ln
- 17150 Turkey Meadow Ln
- 19061 Quail Hollow Dr
- 17154 Turkey Meadow Ln
- 19026 Quail Hollow Dr
- 16957 Ringneck Cir
- 17160 Turkey Meadow Ln
- 19069 Turkey Meadow Ln