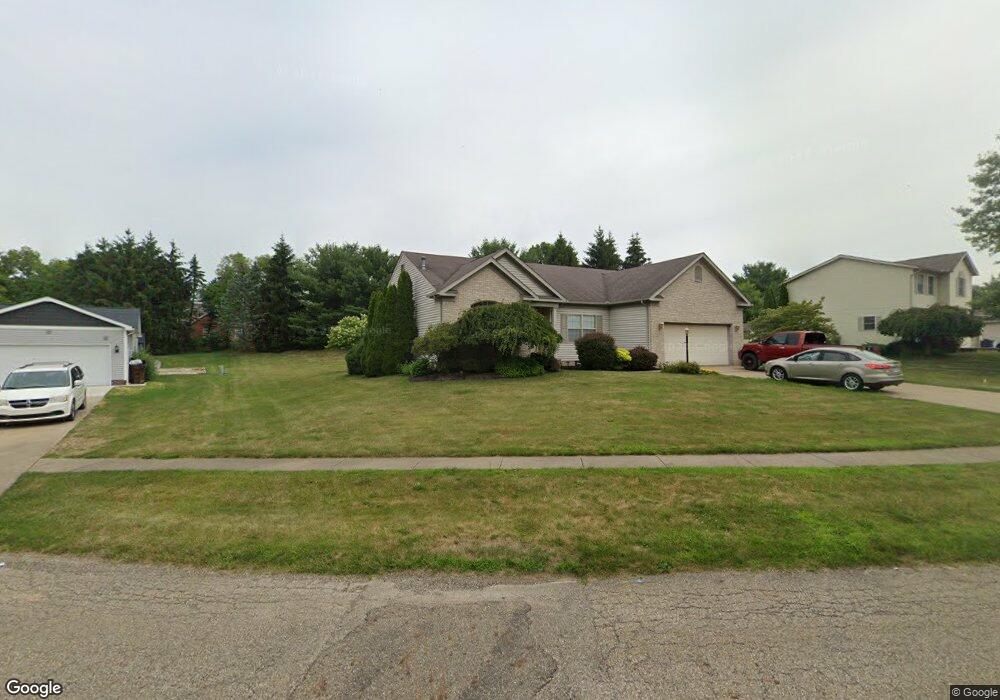
1909 Monter Ave Louisville, OH 44641
Estimated Value: $253,247 - $332,000
3
Beds
2
Baths
1,692
Sq Ft
$172/Sq Ft
Est. Value
About This Home
This home is located at 1909 Monter Ave, Louisville, OH 44641 and is currently estimated at $291,062, approximately $172 per square foot. 1909 Monter Ave is a home located in Stark County with nearby schools including Louisville High School and St. Thomas Aquinas High School & Middle School.
Ownership History
Date
Name
Owned For
Owner Type
Purchase Details
Closed on
Nov 20, 2015
Sold by
Terry Michael D and Terry Stacy L
Bought by
Terry Micahel D and Terry Stacy L
Current Estimated Value
Purchase Details
Closed on
Feb 24, 2009
Sold by
Fannie Mae
Bought by
Terry Michael D and Terry Stacy L
Home Financials for this Owner
Home Financials are based on the most recent Mortgage that was taken out on this home.
Original Mortgage
$141,391
Interest Rate
5.09%
Mortgage Type
FHA
Purchase Details
Closed on
Dec 15, 2008
Sold by
Lepar Nicholas J and Lepar Jeanne M
Bought by
Federal National Mortgage Association
Purchase Details
Closed on
May 30, 2000
Sold by
Architectural Building Inc
Bought by
Lepar Nicholas J and Lepar Jeanne M
Home Financials for this Owner
Home Financials are based on the most recent Mortgage that was taken out on this home.
Original Mortgage
$142,350
Interest Rate
7.5%
Mortgage Type
Construction
Create a Home Valuation Report for This Property
The Home Valuation Report is an in-depth analysis detailing your home's value as well as a comparison with similar homes in the area
Home Values in the Area
Average Home Value in this Area
Purchase History
| Date | Buyer | Sale Price | Title Company |
|---|---|---|---|
| Terry Micahel D | -- | Attorney | |
| Terry Michael D | $144,000 | Beacon Ttiel Agency Inc | |
| Federal National Mortgage Association | $108,000 | None Available | |
| Lepar Nicholas J | $30,000 | -- |
Source: Public Records
Mortgage History
| Date | Status | Borrower | Loan Amount |
|---|---|---|---|
| Previous Owner | Terry Michael D | $141,391 | |
| Previous Owner | Lepar Nicholas J | $142,350 |
Source: Public Records
Tax History Compared to Growth
Tax History
| Year | Tax Paid | Tax Assessment Tax Assessment Total Assessment is a certain percentage of the fair market value that is determined by local assessors to be the total taxable value of land and additions on the property. | Land | Improvement |
|---|---|---|---|---|
| 2025 | -- | $73,790 | $16,490 | $57,300 |
| 2024 | -- | $73,790 | $16,490 | $57,300 |
| 2023 | $2,988 | $69,550 | $15,540 | $54,010 |
| 2022 | $2,995 | $69,550 | $15,540 | $54,010 |
| 2021 | $3,003 | $69,550 | $15,540 | $54,010 |
| 2020 | $2,474 | $62,230 | $14,000 | $48,230 |
| 2019 | $2,478 | $61,150 | $13,690 | $47,460 |
| 2018 | $2,432 | $61,150 | $13,690 | $47,460 |
| 2017 | $2,292 | $55,620 | $12,010 | $43,610 |
| 2016 | $2,339 | $55,620 | $12,010 | $43,610 |
| 2015 | $2,346 | $55,620 | $12,010 | $43,610 |
| 2014 | $183 | $48,100 | $10,400 | $37,700 |
| 2013 | $1,095 | $48,100 | $10,400 | $37,700 |
Source: Public Records
Map
Nearby Homes
- 1812 E Broad St
- 2015 E Main St
- 1715 High St
- 0 Michigan Blvd
- 2110 Edmar St
- 308 Superior St
- 641 S Nickelplate St
- 520 S Silver St
- 728 E Broad St
- 1170 Winding Ridge Ave
- 325 Lincoln Ave
- 910 Crosswyck Cir
- 204 E Broad St
- 510 S Bauman Ct
- 3390 Meese Rd NE
- 107 E Broad St
- 908 Sand Lot Cir
- 5495 Meese Rd NE
- 316 E Reno Dr
- 428 Honeycrisp Dr NE
- 1919 Monter Ave
- 1827 Monter Ave
- 174 Beau Chemin Ave Unit 5B
- 2007 Monter Ave
- 171 Beau Chemin Ave Unit 7A
- 170 Beau Chemin Ave
- 175 Beau Chemin Ave Unit 7D
- 176 Beau Chemin Ave
- 1816 Monter Ave
- 246 Cypress Ave
- 173 Beau Chemin Ave Unit 7B
- 172 Beau Chemin Ave
- 177 Beau Chemin Ave Unit 7C
- 238 Cypress Ave
- 162 Beau Chemin Ave Unit 4D
- 1804 Monter Ave
- 228 Cypress Ave
- 160 Beau Chemin Ave
- 166 Beau Chemin Ave Unit 4C
- 166 Beau Chemin Ave Unit 4C