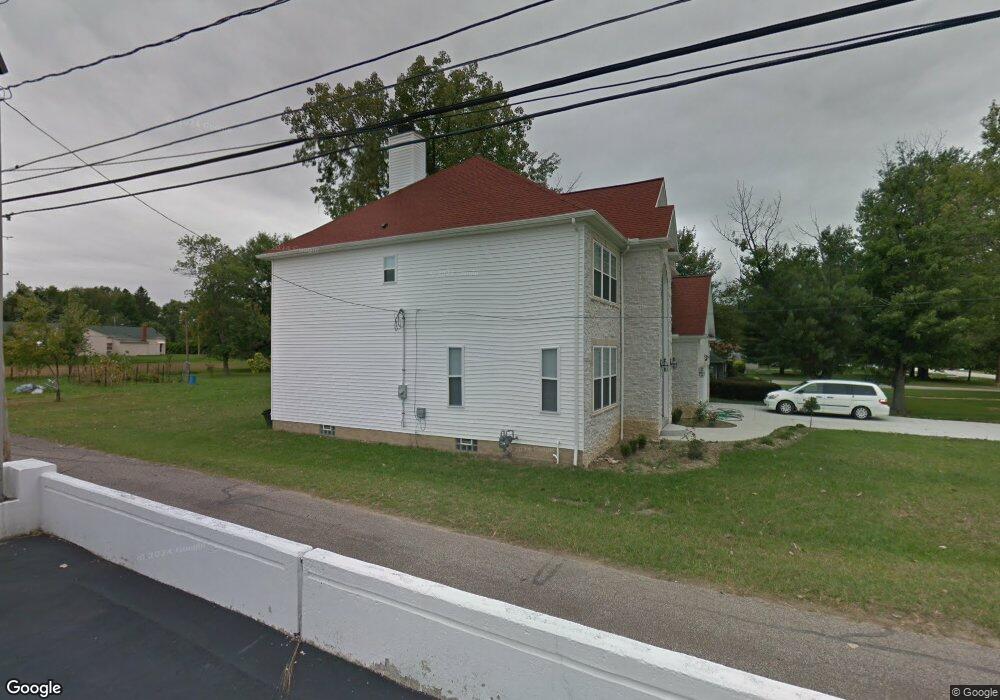
19103 Pierce Dr Strongsville, OH 44149
Estimated Value: $445,000 - $592,313
4
Beds
3
Baths
2,804
Sq Ft
$188/Sq Ft
Est. Value
About This Home
This home is located at 19103 Pierce Dr, Strongsville, OH 44149 and is currently estimated at $527,578, approximately $188 per square foot. 19103 Pierce Dr is a home with nearby schools including Strongsville High School, Strongsville Academy, and Sts Joseph & John Interparochial School.
Ownership History
Date
Name
Owned For
Owner Type
Purchase Details
Closed on
Aug 1, 2013
Sold by
Sprague Linda Lee
Bought by
Kalynyuk Ivan and Kalynyuk Halyna
Current Estimated Value
Purchase Details
Closed on
Oct 20, 2011
Sold by
Valore Helen
Bought by
Strong City Plaza Llc
Purchase Details
Closed on
Dec 17, 2005
Sold by
Sprague Lee B and Sprague Irene A
Bought by
Sprague Linda Lee
Purchase Details
Closed on
Feb 15, 2001
Sold by
Sprague Irene A
Bought by
Sprague Irene A and Irene A Sprague Revocable Trust
Purchase Details
Closed on
Oct 15, 1991
Sold by
Sprague Irene A
Bought by
Sprague Irene A
Purchase Details
Closed on
Sep 30, 1991
Sold by
Slater Michael K
Bought by
Sprague Irene A
Purchase Details
Closed on
Dec 28, 1990
Sold by
Fink Mary C
Bought by
Slater Michael K
Purchase Details
Closed on
Jan 1, 1975
Bought by
Bauer Karl
Create a Home Valuation Report for This Property
The Home Valuation Report is an in-depth analysis detailing your home's value as well as a comparison with similar homes in the area
Home Values in the Area
Average Home Value in this Area
Purchase History
| Date | Buyer | Sale Price | Title Company |
|---|---|---|---|
| Kalynyuk Ivan | $20,000 | Barristers Title Agency | |
| Strong City Plaza Llc | -- | Attorney | |
| Sprague Linda Lee | -- | None Available | |
| Sprague Irene A | -- | -- | |
| Sprague Irene A | -- | -- | |
| Sprague Irene A | $20,500 | -- | |
| Slater Michael K | -- | -- | |
| Fink Mary C | -- | -- | |
| Slater Michael K | $5,000 | -- | |
| Fink Mary C | $5,000 | -- | |
| Bauer Dorothy | -- | -- | |
| Bauer Karl | -- | -- |
Source: Public Records
Tax History Compared to Growth
Tax History
| Year | Tax Paid | Tax Assessment Tax Assessment Total Assessment is a certain percentage of the fair market value that is determined by local assessors to be the total taxable value of land and additions on the property. | Land | Improvement |
|---|---|---|---|---|
| 2024 | $8,134 | $196,385 | $16,170 | $180,215 |
| 2023 | $10,826 | $134,400 | $17,150 | $117,250 |
| 2022 | $10,748 | $169,230 | $17,150 | $152,080 |
| 2021 | $10,673 | $169,230 | $17,150 | $152,080 |
| 2020 | $10,581 | $148,440 | $15,050 | $133,390 |
| 2019 | $10,278 | $424,100 | $43,000 | $381,100 |
| 2018 | $4,741 | $150,540 | $15,050 | $135,490 |
| 2017 | $9,924 | $145,850 | $9,070 | $136,780 |
| 2016 | $612 | $9,070 | $9,070 | $0 |
| 2015 | $941 | $9,070 | $9,070 | $0 |
| 2014 | $941 | $8,790 | $8,790 | $0 |
Source: Public Records
Map
Nearby Homes
- 19160 Wheelers Ln
- 14112 Settlers Way
- 19620 Porters Ln Unit 15F
- 19513 Lunn Rd
- 18630 Shurmer Rd
- 20078 Trapper Trail
- 13156 Olympus Way
- 13099 Olympus Way
- 13066 Olympus Way
- 18162 Fawn Cir
- 12539 Olympus Way
- 17069 Partridge Dr
- 15279 Walnut Creek Dr
- 19311 Bradford Ct
- 13236 Tomson Dr
- 15017 Regency Dr
- 12694 Ionia Ct
- 18248 Meadow Ln
- 17289 Akita Ct Unit 4508
- 12385 Corinth Ct
- 19137 Pierce Dr
- 19191 Pierce Dr
- 19132 Temple Dr
- 19199 Pierce Dr
- 19102 Pierce Dr
- 19136 Pierce Dr
- 19190 Temple Dr
- 19190 Pierce Dr
- 19198 Temple Dr
- 19229 Pierce Dr
- 19229 Pierce Dr Unit ID1061255P
- 14616 Pearl Rd
- 14354 Pearl Rd
- 19198 Pierce Dr
- 14312 Pearl Rd
- 19228 Pierce Dr
- 19185 Wheelers Ln
- 19185 Wheelers Ln Unit 130
- 19169 Wheelers Ln Unit 131
- 19201 Wheelers Ln