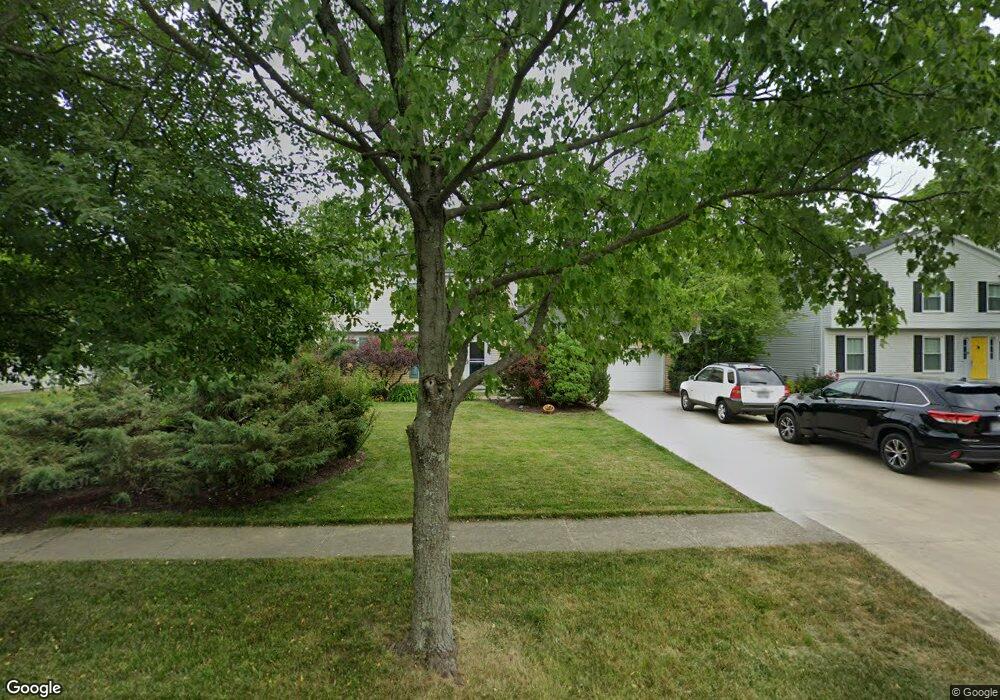
19105 Quail Hollow Dr Strongsville, OH 44136
Estimated Value: $318,677 - $361,000
4
Beds
3
Baths
1,708
Sq Ft
$199/Sq Ft
Est. Value
About This Home
This home is located at 19105 Quail Hollow Dr, Strongsville, OH 44136 and is currently estimated at $339,169, approximately $198 per square foot. 19105 Quail Hollow Dr is a home located in Cuyahoga County with nearby schools including Strongsville High School and Sts Joseph & John Interparochial School.
Ownership History
Date
Name
Owned For
Owner Type
Purchase Details
Closed on
Nov 18, 1998
Sold by
Shokalook Zoryslava V
Bought by
Shokalook Peter and Shokalook Zor
Current Estimated Value
Home Financials for this Owner
Home Financials are based on the most recent Mortgage that was taken out on this home.
Original Mortgage
$133,000
Interest Rate
6.27%
Purchase Details
Closed on
Jun 23, 1993
Sold by
Schokalook Peter W
Bought by
Shokalook Zoryslava
Purchase Details
Closed on
Sep 1, 1989
Sold by
Mateti Prabhaker
Bought by
Schokalook Peter W
Purchase Details
Closed on
Jul 19, 1983
Sold by
Prabhaker Mateti
Bought by
Mateti Prabhaker
Purchase Details
Closed on
Feb 22, 1977
Sold by
Fleet George E and C V
Bought by
Buckingham George W
Purchase Details
Closed on
Jan 1, 1975
Bought by
Fleet George E and C V
Create a Home Valuation Report for This Property
The Home Valuation Report is an in-depth analysis detailing your home's value as well as a comparison with similar homes in the area
Home Values in the Area
Average Home Value in this Area
Purchase History
| Date | Buyer | Sale Price | Title Company |
|---|---|---|---|
| Shokalook Peter | -- | -- | |
| Shokalook Zoryslava | -- | -- | |
| Schokalook Peter W | $106,000 | -- | |
| Mateti Prabhaker | $40,500 | -- | |
| Prabhaker Mateti | $40,500 | -- | |
| Buckingham George W | $57,500 | -- | |
| Fleet George E | -- | -- |
Source: Public Records
Mortgage History
| Date | Status | Borrower | Loan Amount |
|---|---|---|---|
| Previous Owner | Shokalook Peter | $133,000 |
Source: Public Records
Tax History Compared to Growth
Tax History
| Year | Tax Paid | Tax Assessment Tax Assessment Total Assessment is a certain percentage of the fair market value that is determined by local assessors to be the total taxable value of land and additions on the property. | Land | Improvement |
|---|---|---|---|---|
| 2024 | $4,397 | $103,460 | $25,620 | $77,840 |
| 2023 | $4,171 | $75,780 | $23,730 | $52,050 |
| 2022 | $4,167 | $75,775 | $23,730 | $52,045 |
| 2021 | $4,134 | $75,780 | $23,730 | $52,050 |
| 2020 | $3,721 | $62,130 | $19,460 | $42,670 |
| 2019 | $3,612 | $177,500 | $55,600 | $121,900 |
| 2018 | $3,278 | $62,130 | $19,460 | $42,670 |
| 2017 | $3,137 | $56,040 | $15,680 | $40,360 |
| 2016 | $3,112 | $56,040 | $15,680 | $40,360 |
| 2015 | $3,156 | $56,040 | $15,680 | $40,360 |
| 2014 | $3,156 | $56,040 | $15,680 | $40,360 |
Source: Public Records
Map
Nearby Homes
- 17159 Turkey Meadow Ln
- 16486 S Red Rock Dr
- 16650 Lanier Ave
- 17682 Drake Rd
- 17024 Bear Creek Ln
- 17130 Golden Star Dr
- 18229 Howe Rd
- 18294 Drake Rd
- 16450 Howe Rd
- 17934 Cambridge Oval
- 18411 Yorktown Oval
- 17069 Partridge Dr
- 16711 Beech Cir
- 18162 Fawn Cir
- 15639 Indianhead Ln
- 17259 Woodshire Dr
- 18848 Pearl Rd
- 19297 Lauren Way
- 3550 Boston Rd
- 14985 Camden Cir
- 19097 Quail Hollow Dr
- 19111 Quail Hollow Dr
- 16964 Drake Rd
- 16954 Drake Rd Unit REAR
- 16954 Drake Rd
- 19089 Quail Hollow Dr
- 19125 Quail Hollow Dr
- 19104 Quail Hollow Dr
- 19096 Quail Hollow Dr
- 19112 Quail Hollow Dr
- 16866 Drake Rd
- 19083 Quail Hollow Dr
- 19088 Quail Hollow Dr
- 19122 Quail Hollow Dr
- 16828 Drake Rd
- 16792 Drake Rd
- 19077 Quail Hollow Dr
- 17238 Park Lane Dr
- 16888 Miller Ct
- 17246 Park Lane Dr