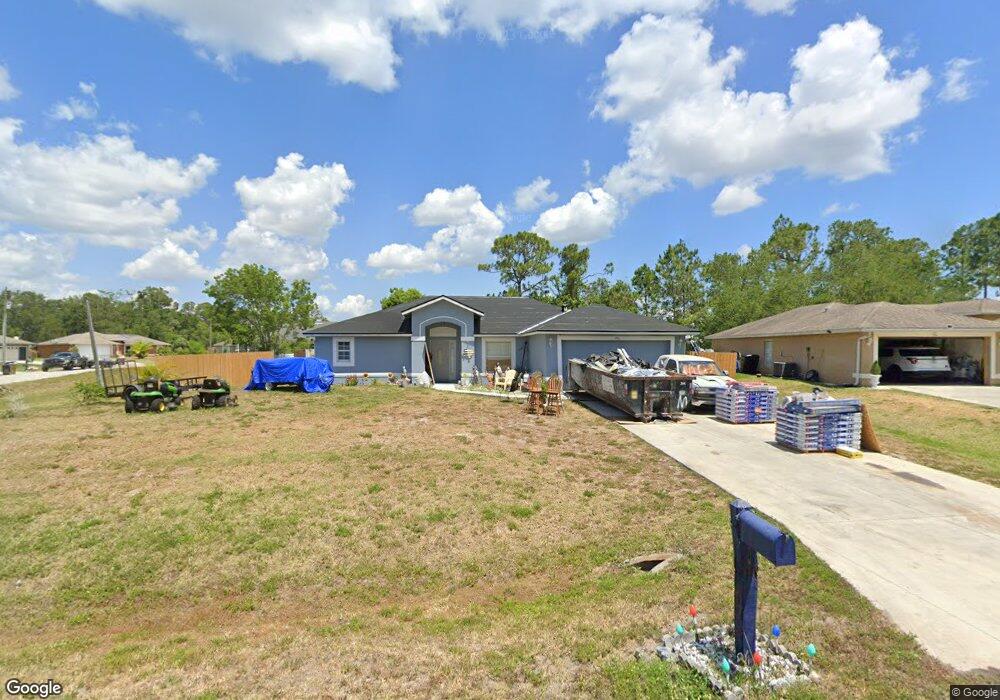
1916 Lorna Ave Lehigh Acres, FL 33972
Joel NeighborhoodEstimated Value: $280,419 - $349,000
3
Beds
2
Baths
1,930
Sq Ft
$166/Sq Ft
Est. Value
About This Home
This home is located at 1916 Lorna Ave, Lehigh Acres, FL 33972 and is currently estimated at $320,355, approximately $165 per square foot. 1916 Lorna Ave is a home located in Lee County with nearby schools including The Alva School, Lehigh Elementary School, and Orange River Elementary School.
Ownership History
Date
Name
Owned For
Owner Type
Purchase Details
Closed on
Mar 29, 2018
Sold by
Rotor Holdings Inc
Bought by
Torres Maria Guadalupe and Gonzales Fidencio
Current Estimated Value
Home Financials for this Owner
Home Financials are based on the most recent Mortgage that was taken out on this home.
Original Mortgage
$167,124
Outstanding Balance
$146,803
Interest Rate
5.5%
Mortgage Type
FHA
Estimated Equity
$173,552
Purchase Details
Closed on
May 28, 2013
Sold by
Lee County Reo Llc
Bought by
Rotor Holdings Inc
Purchase Details
Closed on
Dec 12, 2012
Sold by
Braveman Steven
Bought by
Lee County Reo Llc
Purchase Details
Closed on
Jan 19, 2006
Sold by
Us Home Corp
Bought by
Braveman Steven H and Braveman Rochelle
Home Financials for this Owner
Home Financials are based on the most recent Mortgage that was taken out on this home.
Original Mortgage
$218,392
Interest Rate
6.5%
Mortgage Type
Unknown
Create a Home Valuation Report for This Property
The Home Valuation Report is an in-depth analysis detailing your home's value as well as a comparison with similar homes in the area
Home Values in the Area
Average Home Value in this Area
Purchase History
| Date | Buyer | Sale Price | Title Company |
|---|---|---|---|
| Torres Maria Guadalupe | $182,500 | Aries Title Inc | |
| Rotor Holdings Inc | $88,100 | Title Specialists Of The Gul | |
| Lee County Reo Llc | $65,200 | None Available | |
| Braveman Steven H | $273,000 | North American Title Company |
Source: Public Records
Mortgage History
| Date | Status | Borrower | Loan Amount |
|---|---|---|---|
| Open | Torres Maria Guadalupe | $167,124 | |
| Previous Owner | Braveman Steven H | $218,392 |
Source: Public Records
Tax History Compared to Growth
Tax History
| Year | Tax Paid | Tax Assessment Tax Assessment Total Assessment is a certain percentage of the fair market value that is determined by local assessors to be the total taxable value of land and additions on the property. | Land | Improvement |
|---|---|---|---|---|
| 2025 | $3,264 | $239,665 | $18,169 | $216,711 |
| 2024 | $3,260 | $243,929 | $15,283 | $223,137 |
| 2023 | $3,260 | $246,680 | $9,322 | $232,882 |
| 2022 | $3,129 | $182,862 | $0 | $0 |
| 2021 | $2,682 | $166,238 | $7,554 | $158,684 |
| 2020 | $2,600 | $155,855 | $3,900 | $151,955 |
| 2019 | $2,563 | $149,389 | $4,500 | $144,889 |
| 2018 | $2,279 | $134,840 | $4,250 | $130,590 |
| 2017 | $2,167 | $127,581 | $3,700 | $123,881 |
| 2016 | $2,003 | $112,552 | $5,259 | $107,293 |
| 2015 | $1,778 | $89,686 | $3,903 | $85,783 |
| 2014 | -- | $90,993 | $3,894 | $87,099 |
| 2013 | -- | $64,087 | $3,588 | $60,499 |
Source: Public Records
Map
Nearby Homes
- 1910 Lorna Ave
- 207 Ocean Park Dr
- 181 Ocean Park Dr
- 185 Ocean Park Dr
- 186 Ocean Park Dr
- 130 Viewpoint Dr
- 133 Greenbriar Blvd
- 167 Ocean Park Dr
- 127 Ocean Park Dr
- 123 Greenbriar Blvd
- 148 Viewpoint Dr
- 176 Victory Ct
- 187 Victory Ct
- 186 Victory Ct
- 131 Sanborn Dr
- 2007 Welby Ln
- 139 Sanborn Dr
- 2005 Rosa Ct
- 2008 Yuma Ct
- 134 Sanborn Dr
- 1914 Lorna Ave Unit 3
- 1933 Marlay Ave
- 1909 Marlay Ave
- 1907 Marlay Ave
- 1920 Marlay Ave
- 1911 Lorna Ave
- 1918 Marlay Ave
- 1905 Marlay Ave
- 1917 Lorna Ave Unit 8
- 1917 Lorna Ave
- 1912 Lorna Ave
- 1916 Marlay Ave
- 1922 Marlay Ave
- 1903 Marlay Ave
- 1909 Lorna Ave
- 1924 Marlay Ave
- 1914 Marlay Ave
- 1910 Marlay Ave
- 1908 Marlay Ave
- 1908 Lorna Ave