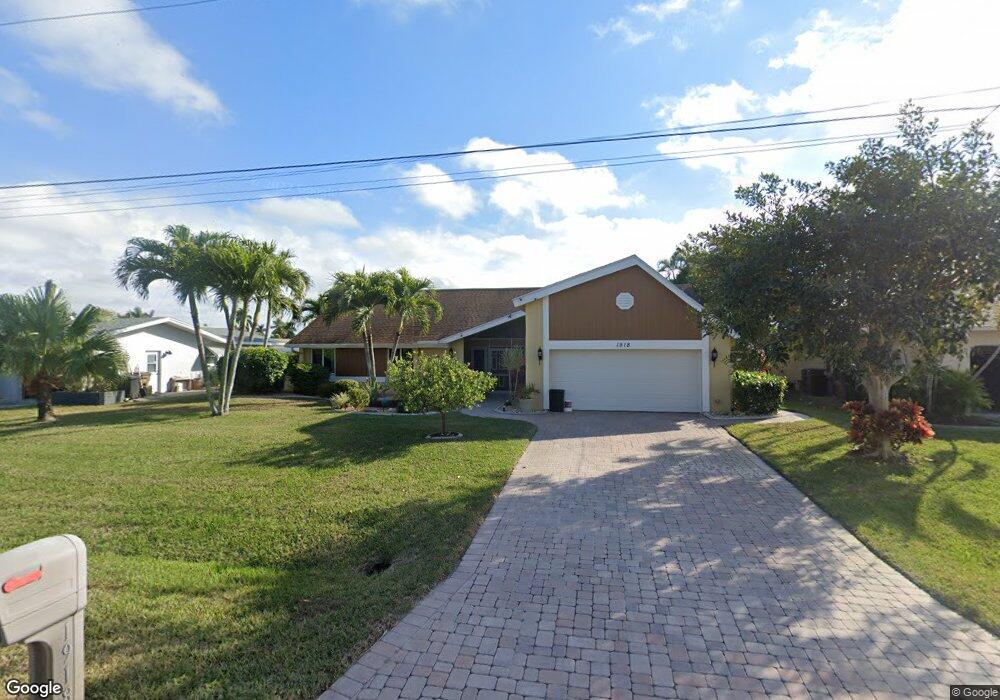
1918 SE 37th Terrace Cape Coral, FL 33904
Caloosahatchee NeighborhoodEstimated Value: $626,415 - $710,000
3
Beds
2
Baths
2,441
Sq Ft
$279/Sq Ft
Est. Value
About This Home
This home is located at 1918 SE 37th Terrace, Cape Coral, FL 33904 and is currently estimated at $680,104, approximately $278 per square foot. 1918 SE 37th Terrace is a home located in Lee County with nearby schools including Cape Elementary School, Caloosa Elementary School, and Tropic Isles Elementary School.
Ownership History
Date
Name
Owned For
Owner Type
Purchase Details
Closed on
Jun 28, 2013
Sold by
Kroencke Alice J and Kroenke Edward A
Bought by
Steadman Donald G and Steadman Catherine M
Current Estimated Value
Home Financials for this Owner
Home Financials are based on the most recent Mortgage that was taken out on this home.
Original Mortgage
$198,750
Outstanding Balance
$141,631
Interest Rate
3.53%
Mortgage Type
New Conventional
Estimated Equity
$538,473
Purchase Details
Closed on
Oct 3, 2000
Sold by
Kroencke Edward A and Kroencke Alice J
Bought by
Kroencke Alice J
Purchase Details
Closed on
Apr 22, 1994
Sold by
Macnerland William D and Macnerland Phyllis A
Bought by
Kroencke Edward A and Kroencke Alice J
Home Financials for this Owner
Home Financials are based on the most recent Mortgage that was taken out on this home.
Original Mortgage
$100,000
Interest Rate
7.61%
Create a Home Valuation Report for This Property
The Home Valuation Report is an in-depth analysis detailing your home's value as well as a comparison with similar homes in the area
Home Values in the Area
Average Home Value in this Area
Purchase History
| Date | Buyer | Sale Price | Title Company |
|---|---|---|---|
| Steadman Donald G | $265,000 | Paradise Professional Title | |
| Kroencke Alice J | -- | -- | |
| Kroencke Edward A | $185,000 | -- |
Source: Public Records
Mortgage History
| Date | Status | Borrower | Loan Amount |
|---|---|---|---|
| Open | Steadman Donald G | $198,750 | |
| Previous Owner | Kroencke Edward A | $100,000 |
Source: Public Records
Tax History Compared to Growth
Tax History
| Year | Tax Paid | Tax Assessment Tax Assessment Total Assessment is a certain percentage of the fair market value that is determined by local assessors to be the total taxable value of land and additions on the property. | Land | Improvement |
|---|---|---|---|---|
| 2025 | $4,980 | $317,868 | -- | -- |
| 2024 | $4,822 | $308,910 | -- | -- |
| 2023 | $4,822 | $294,913 | $0 | $0 |
| 2022 | $4,613 | $291,178 | $0 | $0 |
| 2021 | $4,771 | $348,880 | $177,467 | $171,413 |
| 2020 | $4,863 | $278,794 | $0 | $0 |
| 2019 | $4,723 | $272,526 | $0 | $0 |
| 2018 | $4,725 | $267,445 | $0 | $0 |
| 2017 | $4,683 | $261,944 | $0 | $0 |
| 2016 | $4,622 | $265,543 | $177,062 | $88,481 |
| 2015 | $4,600 | $251,191 | $175,707 | $75,484 |
| 2014 | -- | $251,704 | $153,625 | $98,079 |
| 2013 | -- | $223,105 | $150,543 | $72,562 |
Source: Public Records
Map
Nearby Homes
- 1939 SE 37th Terrace
- 1935 SE 36th Terrace
- 3720 SE 21st Place
- 3610 SE 18th Place
- 3735 SE 21st Place
- 3913 SE 19th Ave
- 3917 SE 19th Ave
- 1950 SE 36th St
- 1740 Savona Pkwy
- 3728 SE 18th Ave
- 3605 SE 18th Ave
- 1911 SE 35th St
- 4002 SE 20th Place Unit 4
- 4013 SE 20th Place Unit 401
- 4013 SE 20th Place Unit 505
- 1929 SE 40th Terrace Unit 2
- 4015 SE 20th Place Unit 206
- 4015 SE 20th Place Unit 301
- 4015 SE 20th Place Unit 503
- 1911 SE 40th Terrace Unit 201
- 1922 SE 37th Terrace
- 1914 SE 37th Terrace
- 1910 SE 37th Terrace
- 1915 SE 37th Terrace
- 1928 SE 37th Terrace
- 1919 SE 37th Terrace
- 1911 SE 37th Terrace
- 1927 Savona Pkwy
- 1923 Savona Pkwy
- 1906 SE 37th Terrace
- 1919 Savona Pkwy
- 1907 SE 37th Terrace
- 1927 SE 37th Terrace
- 1935 Savona Pkwy
- 1934 SE 37th Terrace
- 1915 Savona Pkwy
- 1902 SE 37th Terrace
- 1903 SE 37th Terrace
- 1931 SE 37th Terrace
- 1939 Savona Pkwy