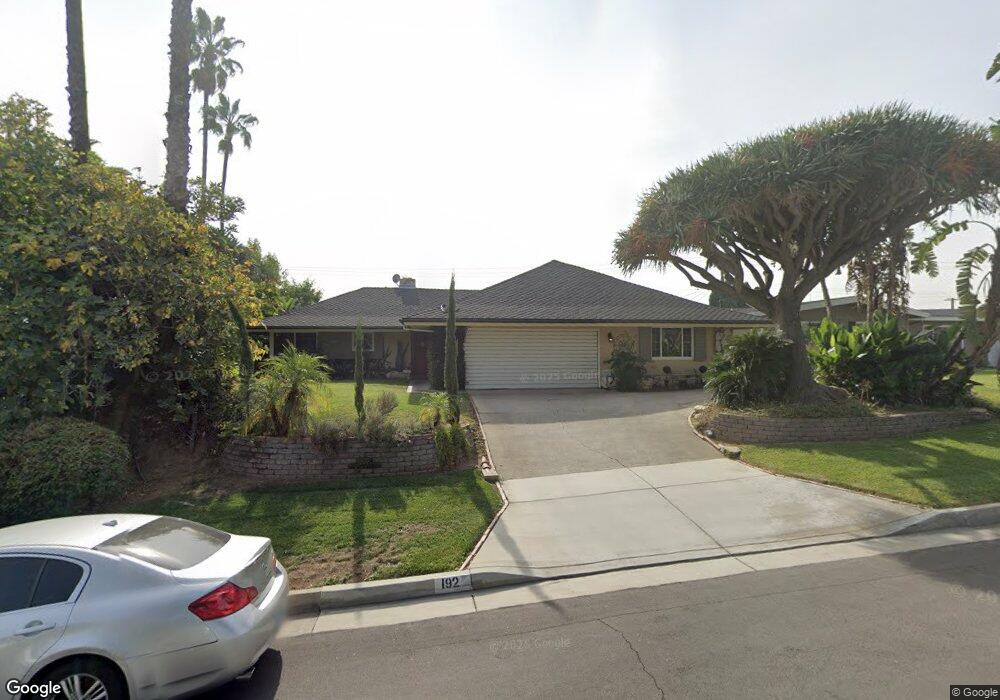
192 Janine Dr La Habra, CA 90631
Estimated Value: $970,290 - $1,344,000
3
Beds
2
Baths
1,932
Sq Ft
$570/Sq Ft
Est. Value
About This Home
This home is located at 192 Janine Dr, La Habra, CA 90631 and is currently estimated at $1,100,323, approximately $569 per square foot. 192 Janine Dr is a home located in Los Angeles County with nearby schools including El Portal Elementary School, Rancho-Starbuck Intermediate School, and La Habra High School.
Ownership History
Date
Name
Owned For
Owner Type
Purchase Details
Closed on
Aug 13, 2015
Sold by
Baeni Dominique and Baeni Sandra
Bought by
Baeni Dominique and Baeni Sandra
Current Estimated Value
Home Financials for this Owner
Home Financials are based on the most recent Mortgage that was taken out on this home.
Original Mortgage
$315,000
Outstanding Balance
$240,982
Interest Rate
3.25%
Mortgage Type
Adjustable Rate Mortgage/ARM
Estimated Equity
$859,341
Purchase Details
Closed on
Dec 27, 2013
Sold by
California Domestic Water Company
Bought by
La Habra Utility Authority
Purchase Details
Closed on
Apr 7, 1999
Sold by
Morger Michel and Morger Karin
Bought by
Baeni Dominique and Baeni Sandra
Home Financials for this Owner
Home Financials are based on the most recent Mortgage that was taken out on this home.
Original Mortgage
$175,000
Interest Rate
6.96%
Create a Home Valuation Report for This Property
The Home Valuation Report is an in-depth analysis detailing your home's value as well as a comparison with similar homes in the area
Home Values in the Area
Average Home Value in this Area
Purchase History
| Date | Buyer | Sale Price | Title Company |
|---|---|---|---|
| Baeni Dominique | -- | Pacific Coast Title Company | |
| La Habra Utility Authority | -- | None Available | |
| Baeni Dominique | $244,000 | Chicago Title |
Source: Public Records
Mortgage History
| Date | Status | Borrower | Loan Amount |
|---|---|---|---|
| Open | Baeni Dominique | $315,000 | |
| Closed | Baeni Dominique | $175,000 |
Source: Public Records
Tax History Compared to Growth
Tax History
| Year | Tax Paid | Tax Assessment Tax Assessment Total Assessment is a certain percentage of the fair market value that is determined by local assessors to be the total taxable value of land and additions on the property. | Land | Improvement |
|---|---|---|---|---|
| 2025 | $4,576 | $376,223 | $226,677 | $149,546 |
| 2024 | $4,576 | $368,847 | $222,233 | $146,614 |
| 2023 | $4,480 | $361,616 | $217,876 | $143,740 |
| 2022 | $4,390 | $354,526 | $213,604 | $140,922 |
| 2021 | $4,338 | $347,575 | $209,416 | $138,159 |
| 2019 | $4,228 | $337,267 | $203,205 | $134,062 |
| 2018 | $3,963 | $330,655 | $199,221 | $131,434 |
| 2016 | $3,780 | $317,817 | $191,486 | $126,331 |
| 2015 | $3,636 | $313,044 | $188,610 | $124,434 |
| 2014 | -- | $306,913 | $184,916 | $121,997 |
Source: Public Records
Map
Nearby Homes
- 188 Madelena Dr
- 1230 Sunbird Ave
- 1320 Marlei Rd
- 1020 La Serna Ave
- 1421 Launer Dr
- 9422 Canfield Dr
- 1000 Dolores St
- 9915 Corella Ave
- 16875 Sausalito Dr
- 9331 Mikinda Ave
- 320 -330 Monte Vista
- 1620 El Travesia Dr
- 2311 Canfield Dr
- 506 Dorothea Rd
- 2401 Canfield Dr
- 950 N Walnut St
- 401 Granada Dr
- 421 N Marian St
- 161 W Hidden Ln
- 2100 Gregory Ln
- 182 Janine Dr
- 1401 Sansinena Ln
- 1411 Sansinena Ln
- 189 Janine Dr
- 1202 Antoinette Dr
- 1421 Sansinena Ln
- 174 Janine Dr
- 197 Janine Dr
- 1210 Antoinette Dr
- 1520 Antoinette Dr
- 179 Janine Dr
- 1431 Sansinena Ln
- 1214 Antoinette Dr
- 1500 Antoinette Dr
- 164 Janine Dr
- 1441 Sansinena Ln
- 171 Janine Dr
- 1450 Antoinette Dr
- 1410 Sansinena Ln
- 1205 Sunbird Ave