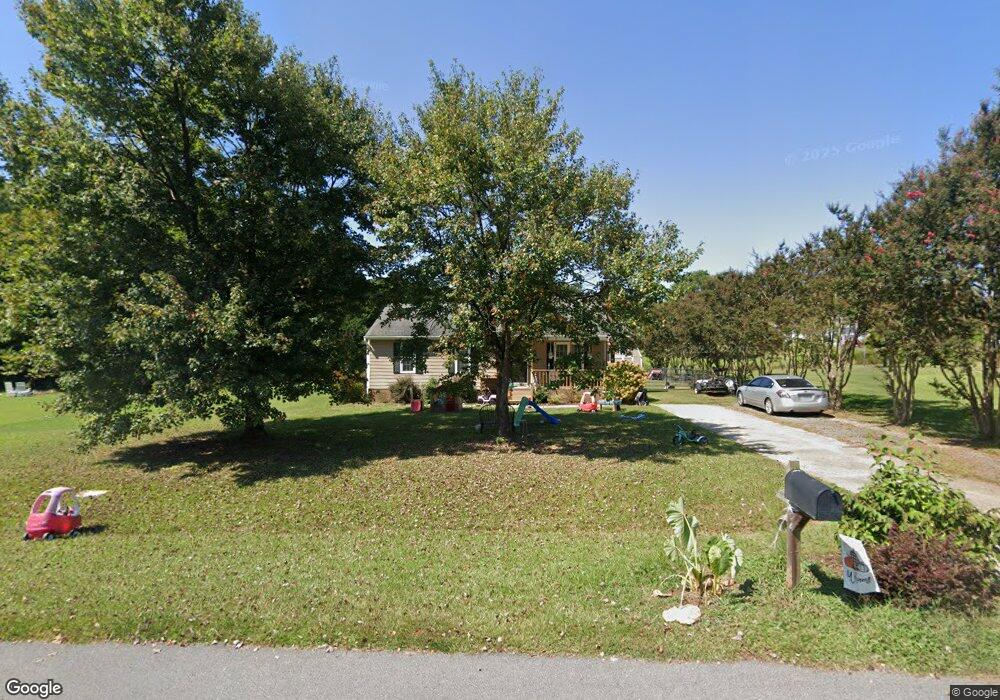
192 Kent St Youngsville, NC 27596
Estimated Value: $241,000 - $281,000
3
Beds
2
Baths
1,001
Sq Ft
$268/Sq Ft
Est. Value
About This Home
This home is located at 192 Kent St, Youngsville, NC 27596 and is currently estimated at $268,559, approximately $268 per square foot. 192 Kent St is a home located in Franklin County with nearby schools including Royal Elementary School, Bunn Middle School, and Bunn High School.
Ownership History
Date
Name
Owned For
Owner Type
Purchase Details
Closed on
Aug 25, 2020
Sold by
Smith Victoria L and Smith Noah J
Bought by
Hanchey Bryce and Smith Kailyn
Current Estimated Value
Home Financials for this Owner
Home Financials are based on the most recent Mortgage that was taken out on this home.
Original Mortgage
$174,775
Outstanding Balance
$154,688
Interest Rate
3%
Mortgage Type
FHA
Estimated Equity
$113,871
Purchase Details
Closed on
Nov 16, 2015
Sold by
Burns David and Burns Stephanie
Bought by
Smith Victoria L and Smith Noah J
Home Financials for this Owner
Home Financials are based on the most recent Mortgage that was taken out on this home.
Original Mortgage
$117,223
Interest Rate
3.89%
Mortgage Type
New Conventional
Purchase Details
Closed on
Jul 27, 2015
Sold by
Ely Earl R and Ely Jennifer Michele
Bought by
Burns David
Purchase Details
Closed on
Aug 1, 1995
Bought by
Ely Earl R and Ely Melissa H
Create a Home Valuation Report for This Property
The Home Valuation Report is an in-depth analysis detailing your home's value as well as a comparison with similar homes in the area
Home Values in the Area
Average Home Value in this Area
Purchase History
| Date | Buyer | Sale Price | Title Company |
|---|---|---|---|
| Hanchey Bryce | $178,000 | None Available | |
| Smith Victoria L | $114,000 | None Available | |
| Burns David | $65,000 | Attorney | |
| Ely Earl R | $73,000 | -- |
Source: Public Records
Mortgage History
| Date | Status | Borrower | Loan Amount |
|---|---|---|---|
| Open | Hanchey Bryce | $174,775 | |
| Previous Owner | Smith Victoria L | $117,223 |
Source: Public Records
Tax History Compared to Growth
Tax History
| Year | Tax Paid | Tax Assessment Tax Assessment Total Assessment is a certain percentage of the fair market value that is determined by local assessors to be the total taxable value of land and additions on the property. | Land | Improvement |
|---|---|---|---|---|
| 2025 | $1,516 | $246,580 | $91,200 | $155,380 |
| 2024 | $1,491 | $246,580 | $91,200 | $155,380 |
| 2023 | $1,152 | $121,200 | $36,000 | $85,200 |
| 2022 | $1,142 | $121,200 | $36,000 | $85,200 |
| 2021 | $1,154 | $121,200 | $36,000 | $85,200 |
| 2020 | $1,161 | $121,200 | $36,000 | $85,200 |
| 2019 | $1,140 | $121,200 | $36,000 | $85,200 |
| 2018 | $1,137 | $121,200 | $36,000 | $85,200 |
| 2017 | $1,071 | $103,430 | $30,000 | $73,430 |
| 2016 | $1,107 | $103,430 | $30,000 | $73,430 |
| 2015 | $917 | $84,290 | $30,000 | $54,290 |
| 2014 | $847 | $84,290 | $30,000 | $54,290 |
Source: Public Records
Map
Nearby Homes
- 3555 Nc 98 Hwy W
- 50 Babbling Creek Dr
- 150 Babbling Creek Dr
- 10 Shorrey Place
- 95 Shorrey Place
- 85 Old Garden Ln
- 40 Muirfield Dr
- 20 Willows Den Ct
- 85 Arbor Dr
- 25 Arbor Dr
- 85 Weathered Oak Way
- 0 Cowboys Trail
- 150 Williamston Ridge Dr
- 20 Richmond Place
- 105 Teal Dr
- 463 Robbins Rd
- 65 Linnett Ct
- 90 Eagle Chase Dr
- 115 Parkers Gate Dr
- 136 Dixie Ln