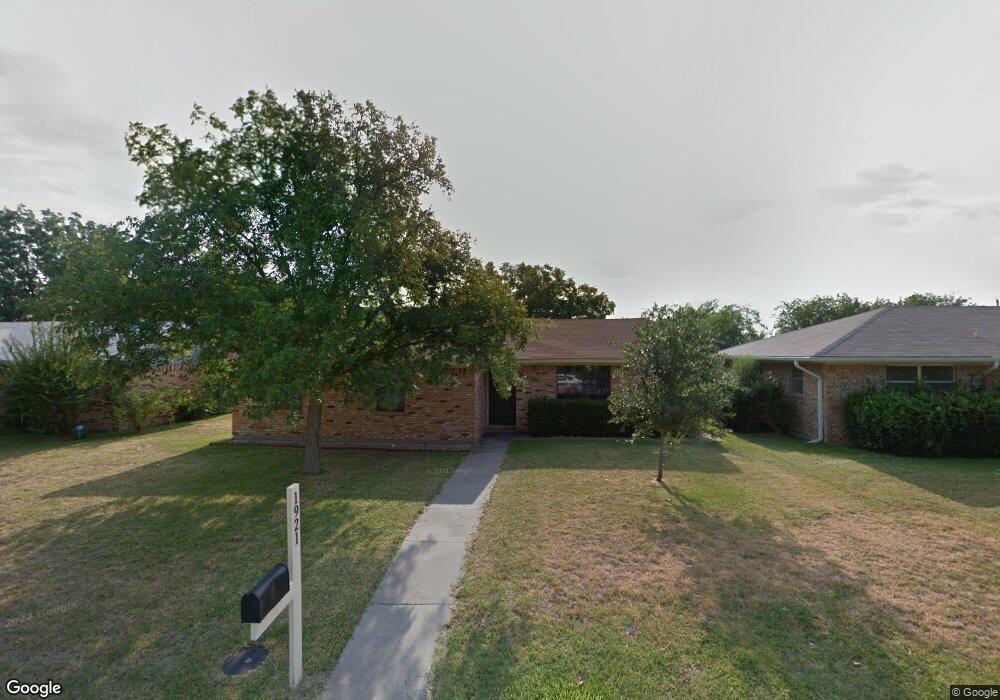
1921 Arkansas St Gainesville, TX 76240
Estimated Value: $224,000 - $243,000
3
Beds
2
Baths
1,488
Sq Ft
$158/Sq Ft
Est. Value
About This Home
This home is located at 1921 Arkansas St, Gainesville, TX 76240 and is currently estimated at $234,781, approximately $157 per square foot. 1921 Arkansas St is a home located in Cooke County with nearby schools including Edison Elementary School, W.E. Chalmers Elementary School, and Gainesville Intermediate School.
Ownership History
Date
Name
Owned For
Owner Type
Purchase Details
Closed on
Apr 9, 2012
Sold by
Agee John Bradley and Agee Kristina L
Bought by
Burnard Mark J and Burnard Jeannettte E
Current Estimated Value
Home Financials for this Owner
Home Financials are based on the most recent Mortgage that was taken out on this home.
Original Mortgage
$92,857
Outstanding Balance
$63,860
Interest Rate
3.97%
Mortgage Type
New Conventional
Estimated Equity
$170,921
Purchase Details
Closed on
Jun 23, 2006
Sold by
Prescher Bonny and Prescher Florence
Bought by
Wood Dusty L and Wood Elizabeth H
Home Financials for this Owner
Home Financials are based on the most recent Mortgage that was taken out on this home.
Original Mortgage
$85,000
Interest Rate
6.56%
Mortgage Type
New Conventional
Create a Home Valuation Report for This Property
The Home Valuation Report is an in-depth analysis detailing your home's value as well as a comparison with similar homes in the area
Home Values in the Area
Average Home Value in this Area
Purchase History
| Date | Buyer | Sale Price | Title Company |
|---|---|---|---|
| Burnard Mark J | -- | None Available | |
| Wood Dusty L | -- | -- |
Source: Public Records
Mortgage History
| Date | Status | Borrower | Loan Amount |
|---|---|---|---|
| Open | Burnard Mark J | $92,857 | |
| Previous Owner | Wood Dusty L | $85,000 |
Source: Public Records
Tax History Compared to Growth
Tax History
| Year | Tax Paid | Tax Assessment Tax Assessment Total Assessment is a certain percentage of the fair market value that is determined by local assessors to be the total taxable value of land and additions on the property. | Land | Improvement |
|---|---|---|---|---|
| 2025 | $4,094 | $216,036 | $33,990 | $182,046 |
| 2024 | $4,094 | $216,036 | $33,990 | $182,046 |
| 2023 | $3,556 | $181,243 | $30,888 | $150,355 |
| 2022 | $3,695 | $169,751 | $25,740 | $144,011 |
| 2021 | $3,708 | $143,981 | $17,160 | $126,821 |
| 2020 | $3,398 | $127,952 | $17,160 | $110,792 |
| 2019 | $3,115 | $113,991 | $17,160 | $96,831 |
| 2018 | $2,646 | $96,961 | $8,580 | $88,381 |
| 2017 | $2,528 | $93,001 | $8,580 | $84,421 |
| 2015 | $2,281 | $86,074 | $8,580 | $77,494 |
| 2014 | $2,281 | $85,718 | $8,580 | $77,138 |
Source: Public Records
Map
Nearby Homes
- 1813 Arkansas St
- 0 Wolf Run
- 00 Wolf Run
- 1212 Aspen Rd
- 3210 Rural Ranch Rd Unit 14
- 2381 County Road 135
- 1112 Hillside Dr
- 000 N Grand Ave
- 1109 Elmwood St
- 1113 Fair Ave
- 00 O'Neal St
- 1305 Hillcrest Blvd
- 1010 Aspen Rd
- 1306 N Clements St
- 1102 Fair Ave
- 904 Wheeler Creek Dr
- 1016 N Howeth St
- TBD County Rd 131
- 2002 Everglade Dr
- 1520 Olive St
- 1923 Arkansas St
- 1919 Arkansas St
- 1925 Arkansas St
- 1917 Arkansas St
- 1918 Arkansas St
- 1922 Arkansas St
- 1927 Arkansas St
- 1915 Arkansas St
- 1916 Arkansas St
- 1926 Arkansas St
- 1901 Aspen Rd
- 1925 Aspen Rd
- 1913 Arkansas St
- 1914 Arkansas St
- 1929 Arkansas St
- 1927 Aspen Rd
- 1912 Arkansas St
- 1911 Arkansas St
- 1928 Arkansas St
- 1964 N Aspen Rd