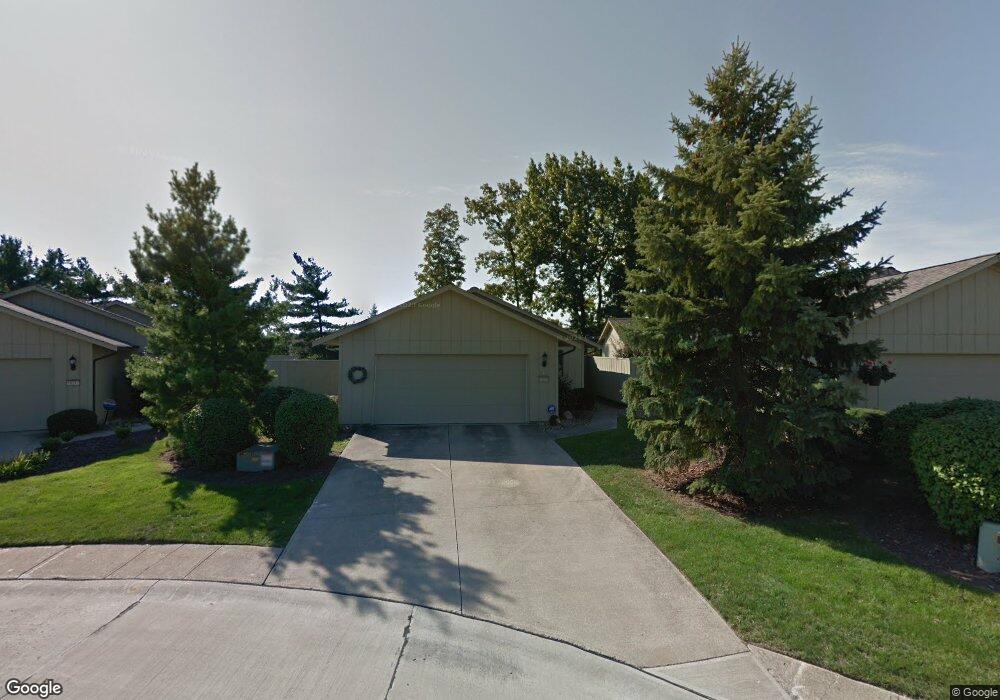
19235 Co Moor Blvd Strongsville, OH 44149
Estimated Value: $266,075 - $330,000
2
Beds
2
Baths
1,445
Sq Ft
$201/Sq Ft
Est. Value
About This Home
This home is located at 19235 Co Moor Blvd, Strongsville, OH 44149 and is currently estimated at $291,019, approximately $201 per square foot. 19235 Co Moor Blvd is a home located in Cuyahoga County with nearby schools including Strongsville High School and Sts Joseph & John Interparochial School.
Ownership History
Date
Name
Owned For
Owner Type
Purchase Details
Closed on
Mar 15, 2018
Sold by
Hughes Christine M
Bought by
Jindra James Leonard and Welsh Kaitlyn Christine
Current Estimated Value
Purchase Details
Closed on
Oct 20, 2010
Sold by
Hughes Scott J
Bought by
Hughes Christine M
Purchase Details
Closed on
Oct 13, 2001
Sold by
Hughes Christine M and Coleman Christine M
Bought by
Hughes Scott J and Hughes Christine M
Home Financials for this Owner
Home Financials are based on the most recent Mortgage that was taken out on this home.
Original Mortgage
$132,000
Interest Rate
6.39%
Purchase Details
Closed on
Oct 20, 1999
Sold by
Pridemore Randall and Pridemore Joann
Bought by
Coleman Christine M
Home Financials for this Owner
Home Financials are based on the most recent Mortgage that was taken out on this home.
Original Mortgage
$131,000
Interest Rate
7.91%
Purchase Details
Closed on
May 27, 1992
Sold by
Brinkman George M
Bought by
Pridemore Randall
Purchase Details
Closed on
Jan 1, 1988
Bought by
Brinkman George M
Create a Home Valuation Report for This Property
The Home Valuation Report is an in-depth analysis detailing your home's value as well as a comparison with similar homes in the area
Home Values in the Area
Average Home Value in this Area
Purchase History
| Date | Buyer | Sale Price | Title Company |
|---|---|---|---|
| Jindra James Leonard | -- | None Available | |
| Hughes Christine M | -- | Attorney | |
| Hughes Scott J | -- | -- | |
| Coleman Christine M | $138,000 | -- | |
| Pridemore Randall | $116,500 | -- | |
| Brinkman George M | -- | -- |
Source: Public Records
Mortgage History
| Date | Status | Borrower | Loan Amount |
|---|---|---|---|
| Previous Owner | Hughes Scott J | $132,000 | |
| Previous Owner | Coleman Christine M | $131,000 |
Source: Public Records
Tax History Compared to Growth
Tax History
| Year | Tax Paid | Tax Assessment Tax Assessment Total Assessment is a certain percentage of the fair market value that is determined by local assessors to be the total taxable value of land and additions on the property. | Land | Improvement |
|---|---|---|---|---|
| 2024 | $4,041 | $86,065 | $14,385 | $71,680 |
| 2023 | $4,133 | $66,010 | $13,790 | $52,220 |
| 2022 | $4,103 | $66,010 | $13,790 | $52,220 |
| 2021 | $4,071 | $66,010 | $13,790 | $52,220 |
| 2020 | $3,773 | $54,110 | $11,310 | $42,810 |
| 2019 | $3,662 | $154,600 | $32,300 | $122,300 |
| 2018 | $3,200 | $54,110 | $11,310 | $42,810 |
| 2017 | $3,135 | $47,250 | $8,610 | $38,640 |
| 2016 | $3,109 | $47,250 | $8,610 | $38,640 |
| 2015 | $3,219 | $47,250 | $8,610 | $38,640 |
| 2014 | $3,219 | $48,240 | $8,790 | $39,450 |
Source: Public Records
Map
Nearby Homes
- 11432 Pearl Rd
- 11499 Pearl Rd Unit A106
- 19240 Briarwood Ln
- 11179 Fawn Meadow Ln
- 10986 Fawn Meadow Ln
- 19997 Idlewood Trail
- 19890 Idlewood Trail
- 20050 Idlewood Trail
- 12385 Corinth Ct
- 12539 Olympus Way
- 18336 Falling Water Rd
- 12647 Edgepark Cir
- 12694 Ionia Ct
- 11650 River Moss Rd
- 13066 Olympus Way
- 18248 Meadow Ln
- 13099 Olympus Way
- 13156 Olympus Way
- 17945 Cliffside Dr
- 20424 Scotch Pine Way
- 19211 Co Moor Blvd
- 19247 Co Moor Blvd
- 19259 Co Moor Blvd
- 11533 Co Moor Blvd
- 11515 Co Moor Blvd
- 11494 Co Moor Blvd
- 11497 Co Moor Blvd
- 19301 Co Moor Blvd
- 11476 Co Moor Blvd
- 11479 Co Moor Blvd
- 11461 Co Moor Blvd
- 19313 Co Moor Blvd
- 11458 Co Moor Blvd
- 19325 Co Moor Blvd
- 11443 Co Moor Blvd
- 11440 Co Moor Blvd
- 11474 Pearl Rd
- 19337 Co Moor Blvd
- 11425 Co Moor Blvd
- 11422 Co Moor Blvd