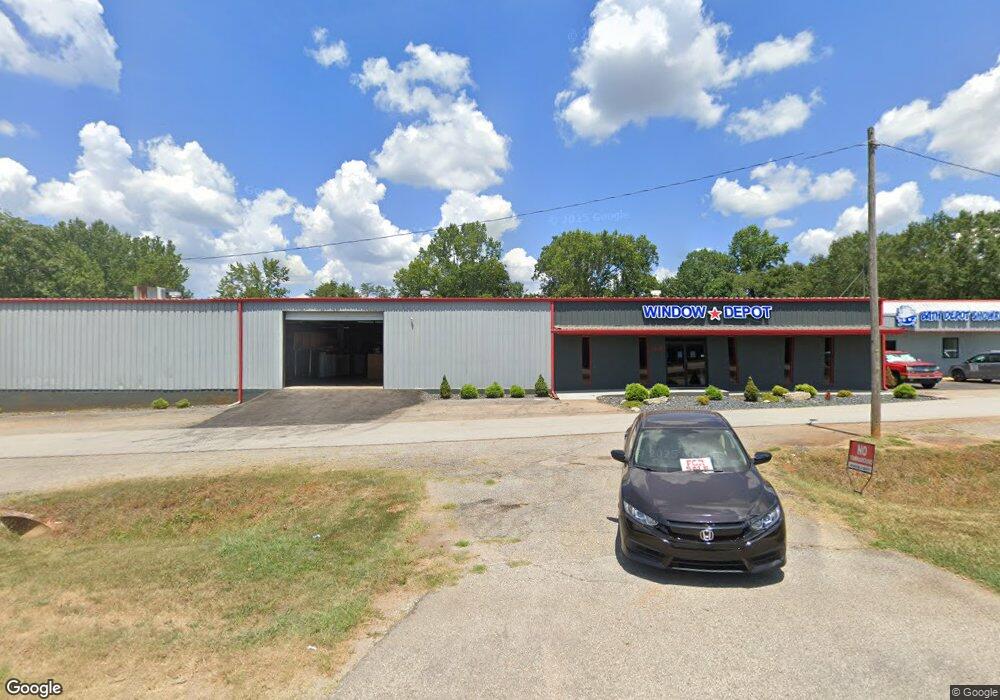
1925 Fort Prince Blvd Wellford, SC 29385
Estimated Value: $727,254
--
Bed
--
Bath
18,600
Sq Ft
$39/Sq Ft
Est. Value
About This Home
This home is located at 1925 Fort Prince Blvd, Wellford, SC 29385 and is currently estimated at $727,254, approximately $39 per square foot. 1925 Fort Prince Blvd is a home located in Spartanburg County with nearby schools including Dorman High School Freshman Campus and Dorman High School.
Ownership History
Date
Name
Owned For
Owner Type
Purchase Details
Closed on
May 16, 2022
Sold by
Prospect Leasing Llc
Bought by
Kitchko Gregory and Kitchko Irina
Current Estimated Value
Home Financials for this Owner
Home Financials are based on the most recent Mortgage that was taken out on this home.
Original Mortgage
$130,000
Outstanding Balance
$122,832
Interest Rate
4.67%
Mortgage Type
Seller Take Back
Estimated Equity
$604,422
Purchase Details
Closed on
Nov 12, 2018
Sold by
Charter Investments Inc
Bought by
Prospect Leasing Llc
Purchase Details
Closed on
Apr 23, 2007
Sold by
Moore Darrell
Bought by
Carroll Matthew
Purchase Details
Closed on
Mar 20, 2007
Sold by
First Warehouse & Storage Llc
Bought by
Prospect Leasing Llc
Purchase Details
Closed on
Feb 16, 2001
Sold by
Freeman Howard
Bought by
First Warehouse & Storage Llc
Create a Home Valuation Report for This Property
The Home Valuation Report is an in-depth analysis detailing your home's value as well as a comparison with similar homes in the area
Home Values in the Area
Average Home Value in this Area
Purchase History
| Date | Buyer | Sale Price | Title Company |
|---|---|---|---|
| Kitchko Gregory | $680,000 | None Listed On Document | |
| Kitchko Gregory | $680,000 | None Listed On Document | |
| Prospect Leasing Llc | $20,000 | None Available | |
| Carroll Matthew | $8,000 | None Available | |
| Prospect Leasing Llc | $258,000 | None Available | |
| First Warehouse & Storage Llc | $145,000 | -- |
Source: Public Records
Mortgage History
| Date | Status | Borrower | Loan Amount |
|---|---|---|---|
| Open | Kitchko Gregory | $130,000 |
Source: Public Records
Tax History Compared to Growth
Tax History
| Year | Tax Paid | Tax Assessment Tax Assessment Total Assessment is a certain percentage of the fair market value that is determined by local assessors to be the total taxable value of land and additions on the property. | Land | Improvement |
|---|---|---|---|---|
| 2025 | $14,443 | $40,800 | $9,000 | $31,800 |
| 2024 | $14,443 | $40,800 | $9,000 | $31,800 |
| 2023 | $14,443 | $40,800 | $9,000 | $31,800 |
| 2022 | $4,987 | $13,188 | $2,844 | $10,344 |
| 2021 | $4,987 | $13,188 | $2,844 | $10,344 |
| 2020 | $4,959 | $13,188 | $2,844 | $10,344 |
| 2019 | $4,954 | $13,188 | $2,844 | $10,344 |
| 2018 | $4,926 | $13,188 | $2,844 | $10,344 |
| 2017 | $4,705 | $12,756 | $2,844 | $9,912 |
| 2016 | $4,660 | $12,756 | $2,844 | $9,912 |
| 2015 | $4,595 | $12,756 | $2,844 | $9,912 |
| 2014 | $4,514 | $12,756 | $2,844 | $9,912 |
Source: Public Records
Map
Nearby Homes
- 0 Deerfield Dr
- 2559 John Dodd Rd
- 669 Neighborhood Rd
- 2578 John Dodd Rd
- 559 Valencia Cir
- 555 Valencia Cir
- 551 Valencia Cir
- 547 Valencia Cir
- 543 Valencia Cir
- 539 Valencia Cir
- 535 Valencia Cir
- 531 Valencia Cir
- Cali Plan at Treemont Commons
- Rachel Plan at Treemont Commons
- Belhaven Plan at Treemont Commons
- Hayden Plan at Treemont Commons
- Penwell Plan at Treemont Commons
- 523 Valencia Cir
- Macon Plan at Treemont Commons
- 00 John Dodd Rd
- 0 John Dodd Rd
- 2249 John Dodd Rd
- 1961 Fort Prince Blvd
- 1904 Fort Prince Blvd
- 2245 John Dodd Rd Unit 2247
- 2264 John Dodd Rd
- 1971 Fort Prince Blvd
- 2241 John Dodd Rd
- 1905 Fort Prince Blvd
- 0 Thompson Rd
- 111 Thompson Rd
- 104 Thompson Rd
- 110 Thompson Rd
- 2274 John Dodd Rd
- 2235 John Dodd Rd
- 1981 Fort Prince Blvd
- 1992 Fort Prince Blvd
- 120 Martin Ln
- 308 Emmie Ln