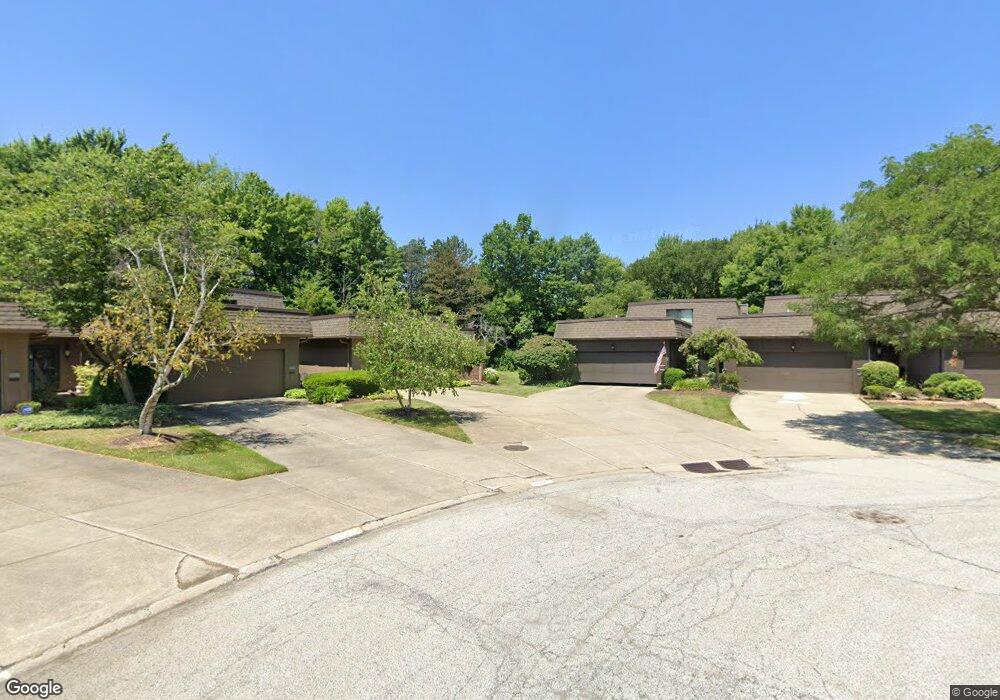
19280 Briarwood Ln Strongsville, OH 44149
Estimated Value: $224,000 - $263,000
3
Beds
3
Baths
1,610
Sq Ft
$154/Sq Ft
Est. Value
About This Home
This home is located at 19280 Briarwood Ln, Strongsville, OH 44149 and is currently estimated at $248,738, approximately $154 per square foot. 19280 Briarwood Ln is a home located in Cuyahoga County with nearby schools including Strongsville High School and Sts Joseph & John Interparochial School.
Ownership History
Date
Name
Owned For
Owner Type
Purchase Details
Closed on
May 22, 2018
Sold by
Kay Richard J and Kayl Marilyn
Bought by
Kay Richard J and Kay Marilyn L
Current Estimated Value
Purchase Details
Closed on
Mar 31, 2012
Sold by
Lee Kay Marilyn and Kay Richard J
Bought by
Kay Richard J and Kay Marilyn L
Purchase Details
Closed on
Apr 22, 1980
Sold by
Kay Richard James
Bought by
Marilyn Lee Kay
Purchase Details
Closed on
Mar 25, 1977
Sold by
Lindemuth Laurence D
Bought by
Kay Richard James
Purchase Details
Closed on
Jun 21, 1976
Sold by
Rothel Richard L
Bought by
Lindemuth Laurence D
Purchase Details
Closed on
Sep 8, 1975
Sold by
Rothel Richard L
Bought by
Rothel Richard L
Purchase Details
Closed on
Jul 11, 1975
Sold by
Conder Joel D and B J
Bought by
Rothel Richard L
Purchase Details
Closed on
Jan 1, 1975
Bought by
Conder Joel D and B J
Create a Home Valuation Report for This Property
The Home Valuation Report is an in-depth analysis detailing your home's value as well as a comparison with similar homes in the area
Home Values in the Area
Average Home Value in this Area
Purchase History
| Date | Buyer | Sale Price | Title Company |
|---|---|---|---|
| Kay Richard J | -- | None Available | |
| Kay Richard J | -- | Attorney | |
| Marilyn Lee Kay | -- | -- | |
| Kay Richard James | $63,000 | -- | |
| Lindemuth Laurence D | $62,500 | -- | |
| Rothel Richard L | -- | -- | |
| Rothel Richard L | $56,500 | -- | |
| Conder Joel D | -- | -- |
Source: Public Records
Tax History Compared to Growth
Tax History
| Year | Tax Paid | Tax Assessment Tax Assessment Total Assessment is a certain percentage of the fair market value that is determined by local assessors to be the total taxable value of land and additions on the property. | Land | Improvement |
|---|---|---|---|---|
| 2024 | $3,557 | $73,990 | $7,385 | $66,605 |
| 2023 | $3,603 | $56,320 | $5,640 | $50,680 |
| 2022 | $3,577 | $56,320 | $5,640 | $50,680 |
| 2021 | $3,552 | $56,320 | $5,640 | $50,680 |
| 2020 | $3,346 | $46,940 | $4,690 | $42,250 |
| 2019 | $3,250 | $134,100 | $13,400 | $120,700 |
| 2018 | $2,675 | $46,940 | $4,690 | $42,250 |
| 2017 | $2,436 | $35,810 | $4,100 | $31,710 |
| 2016 | $2,417 | $35,810 | $4,100 | $31,710 |
| 2015 | $4,066 | $35,810 | $4,100 | $31,710 |
| 2014 | $4,066 | $38,500 | $4,410 | $34,090 |
Source: Public Records
Map
Nearby Homes
- 19240 Briarwood Ln
- 11179 Fawn Meadow Ln
- 10986 Fawn Meadow Ln
- 11432 Pearl Rd
- 11499 Pearl Rd Unit A106
- 19890 Idlewood Trail
- 19997 Idlewood Trail
- 20050 Idlewood Trail
- 12385 Corinth Ct
- 20424 Scotch Pine Way
- 12539 Olympus Way
- 18336 Falling Water Rd
- 12647 Edgepark Cir
- 12694 Ionia Ct
- 20684 Albion Rd
- 11650 River Moss Rd
- 13066 Olympus Way
- 13099 Olympus Way
- 13156 Olympus Way
- 18248 Meadow Ln
- 19272 Briarwood Ln Unit B33
- 19276 Briarwood Ln
- 19270 Briarwood Ln
- 19270 Briarwood Ln Unit 3-4
- 19261 Briarwood Ln Unit 4-3
- 19261 Briarwood Ln Unit 3
- 19257 Briarwood Ln
- 19257 Briarwood Ln Unit 4-2
- 19258 Briarwood Ln Unit 2
- 19246 Briarwood Ln
- 19252 Briarwood Ln
- 19264 Briarwood Ln
- 19246 Briarwood Ln Unit 2-4
- 19258 Briarwood Ln Unit 2-2
- 19252 Briarwood Ln Unit 2-3
- 19253 Briarwood Ln Unit 1
- 19239 Briarwood Ln Unit 1
- 19251 Briarwood Ln
- 19245 Briarwood Ln
- 19239 Briarwood Ln Unit 19239