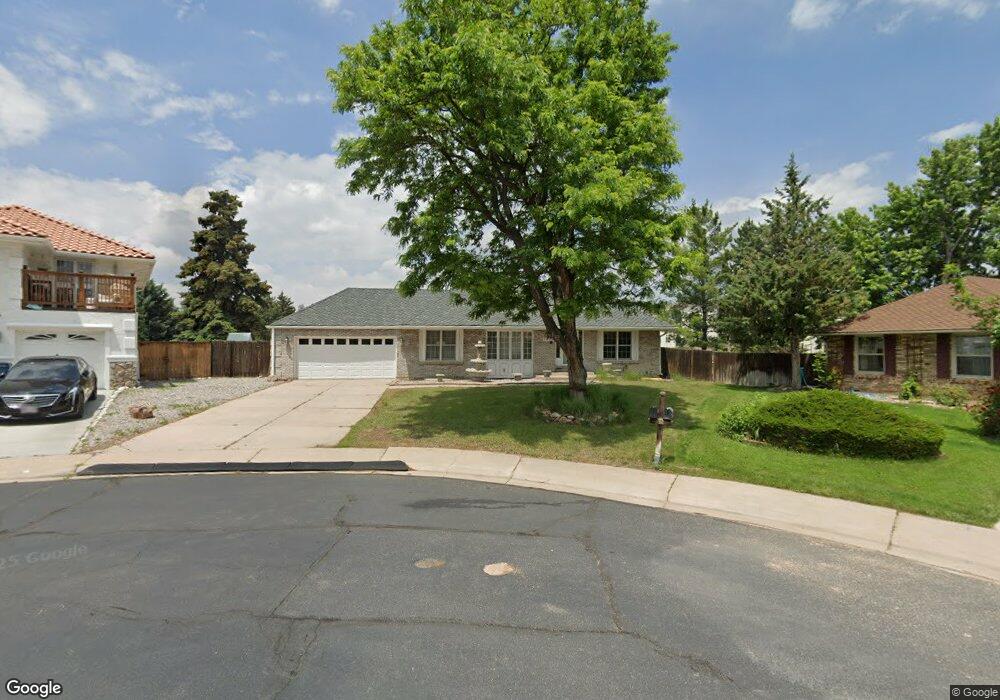
1929 S Jay Ct Lakewood, CO 80227
Thraemoor NeighborhoodEstimated Value: $730,842 - $863,000
4
Beds
4
Baths
3,814
Sq Ft
$213/Sq Ft
Est. Value
About This Home
This home is located at 1929 S Jay Ct, Lakewood, CO 80227 and is currently estimated at $813,461, approximately $213 per square foot. 1929 S Jay Ct is a home located in Jefferson County with nearby schools including Lasley Elementary School, Alameda International High School, and Notre Dame Parish Catholic School.
Ownership History
Date
Name
Owned For
Owner Type
Purchase Details
Closed on
Sep 29, 2009
Sold by
Busnardo Larry
Bought by
Baird Charles M
Current Estimated Value
Home Financials for this Owner
Home Financials are based on the most recent Mortgage that was taken out on this home.
Original Mortgage
$361,446
Outstanding Balance
$236,259
Interest Rate
5.1%
Mortgage Type
VA
Estimated Equity
$577,202
Purchase Details
Closed on
Apr 15, 2003
Sold by
Vullo Luigi and Busnardo Larry
Bought by
Busnardo Larry
Home Financials for this Owner
Home Financials are based on the most recent Mortgage that was taken out on this home.
Original Mortgage
$255,600
Interest Rate
5.8%
Purchase Details
Closed on
Jun 28, 2002
Sold by
Vullo Luigi and Busnardo Larry
Bought by
Busnardo Larry
Purchase Details
Closed on
Dec 22, 2000
Sold by
Bornschlegel Martia J
Bought by
Vullo Luigi and Busnardo Larry
Home Financials for this Owner
Home Financials are based on the most recent Mortgage that was taken out on this home.
Original Mortgage
$255,550
Interest Rate
7.78%
Create a Home Valuation Report for This Property
The Home Valuation Report is an in-depth analysis detailing your home's value as well as a comparison with similar homes in the area
Home Values in the Area
Average Home Value in this Area
Purchase History
| Date | Buyer | Sale Price | Title Company |
|---|---|---|---|
| Baird Charles M | $349,900 | Chicago Title Co | |
| Busnardo Larry | -- | Land Title | |
| Busnardo Larry | -- | -- | |
| Vullo Luigi | $269,000 | Land Title |
Source: Public Records
Mortgage History
| Date | Status | Borrower | Loan Amount |
|---|---|---|---|
| Open | Baird Charles M | $361,446 | |
| Previous Owner | Busnardo Larry | $255,600 | |
| Previous Owner | Vullo Luigi | $255,550 |
Source: Public Records
Tax History Compared to Growth
Tax History
| Year | Tax Paid | Tax Assessment Tax Assessment Total Assessment is a certain percentage of the fair market value that is determined by local assessors to be the total taxable value of land and additions on the property. | Land | Improvement |
|---|---|---|---|---|
| 2024 | $3,256 | $42,388 | $19,712 | $22,676 |
| 2023 | $3,256 | $42,388 | $19,712 | $22,676 |
| 2022 | $2,477 | $33,442 | $13,413 | $20,029 |
| 2021 | $2,512 | $34,404 | $13,799 | $20,605 |
| 2020 | $2,482 | $34,172 | $11,699 | $22,473 |
| 2019 | $3,099 | $34,172 | $11,699 | $22,473 |
| 2018 | $3,062 | $32,619 | $10,675 | $21,944 |
| 2017 | $2,696 | $32,619 | $10,675 | $21,944 |
| 2016 | $2,643 | $29,800 | $8,419 | $21,381 |
| 2015 | $2,245 | $29,800 | $8,419 | $21,381 |
| 2014 | $2,245 | $23,197 | $8,654 | $14,543 |
Source: Public Records
Map
Nearby Homes
- 6068 W Utah Ln
- 1896 S Marshall Cir
- 1894 S Marshall Cir
- 1862 S Jay Ct
- 1851 S Marshall Cir
- 1862 S Marshall Cir
- 5775 W Atlantic Place Unit 303
- 5732 W Atlantic Place Unit 102
- 5735 W Atlantic Place Unit 101
- 5725 W Atlantic Place Unit 103
- 5725 W Atlantic Place Unit 308
- 5745 W Atlantic Place Unit 104
- 5745 W Atlantic Place Unit 207
- 2123 S Gray St
- 5704 W Asbury Place Unit 204
- 6702 W Asbury Place
- 6022 W Warren Ct
- 5445 W Colorado Ave
- 1596 S Fenton St
- 6777 W Mexico Place
- 1921 S Jay Ct
- 1937 S Jay Ct
- 1902 S Lake Rd
- 6131 W Pacific Cir
- 1945 S Jay Ct
- 1900 S Lake Rd
- 6111 W Pacific Cir
- 1910 S Lake Rd
- 6170 W Pacific Cir
- 6120 W Pacific Cir
- 6165 W Pacific Cir
- 6030 W Pacific Cir
- 6155 W Pacific Cir
- 1905 S Lake Rd
- 1967 S Ingalls Ct
- 1804 S Harlan Cir
- 1973 S Ingalls Ct
- 6142 W Pacific Cir
- 6263 W Jewell Ave
- 6145 W Pacific Cir