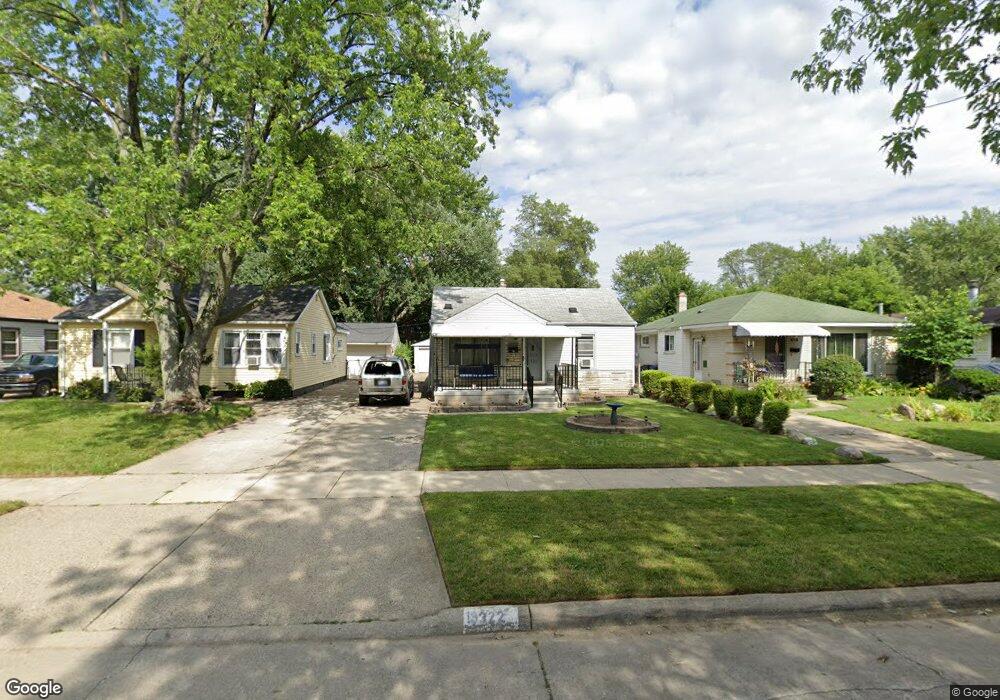
19322 Kinloch Redford, MI 48240
Estimated Value: $162,591 - $181,000
3
Beds
1
Bath
1,218
Sq Ft
$139/Sq Ft
Est. Value
About This Home
This home is located at 19322 Kinloch, Redford, MI 48240 and is currently estimated at $169,648, approximately $139 per square foot. 19322 Kinloch is a home located in Wayne County with nearby schools including Beech Elementary School, Hilbert Elementary School, and David Ellis Academy West.
Ownership History
Date
Name
Owned For
Owner Type
Purchase Details
Closed on
Apr 3, 2020
Sold by
First York Llc
Bought by
Derrico Chimere A
Current Estimated Value
Purchase Details
Closed on
Jun 9, 2016
Sold by
Innomax Home Solutions Llc
Bought by
First York Ii Llc
Purchase Details
Closed on
Jun 6, 2016
Sold by
U S Bank National Association
Bought by
Innomax Home Solutions Llc
Purchase Details
Closed on
Oct 29, 2015
Sold by
Meyers Mary and Meyers Gerald A
Bought by
U S Bank National Association
Create a Home Valuation Report for This Property
The Home Valuation Report is an in-depth analysis detailing your home's value as well as a comparison with similar homes in the area
Home Values in the Area
Average Home Value in this Area
Purchase History
| Date | Buyer | Sale Price | Title Company |
|---|---|---|---|
| Derrico Chimere A | $50,140 | None Available | |
| First York Ii Llc | -- | None Available | |
| Innomax Home Solutions Llc | $21,600 | Premium Title Services Inc | |
| U S Bank National Association | $120,667 | Attorney |
Source: Public Records
Tax History Compared to Growth
Tax History
| Year | Tax Paid | Tax Assessment Tax Assessment Total Assessment is a certain percentage of the fair market value that is determined by local assessors to be the total taxable value of land and additions on the property. | Land | Improvement |
|---|---|---|---|---|
| 2025 | $1,315 | $71,000 | $0 | $0 |
| 2024 | $1,315 | $62,900 | $0 | $0 |
| 2023 | $1,254 | $55,100 | $0 | $0 |
| 2022 | $3,007 | $49,400 | $0 | $0 |
| 2021 | $2,924 | $44,400 | $0 | $0 |
| 2020 | $2,356 | $35,900 | $0 | $0 |
| 2019 | $2,236 | $33,500 | $0 | $0 |
| 2018 | $1,083 | $24,000 | $0 | $0 |
| 2017 | $4,055 | $23,700 | $0 | $0 |
| 2016 | $1,699 | $22,100 | $0 | $0 |
| 2015 | $1,808 | $20,100 | $0 | $0 |
| 2013 | $1,770 | $18,300 | $0 | $0 |
| 2012 | $1,296 | $21,700 | $6,200 | $15,500 |
Source: Public Records
Map
Nearby Homes