1940 S Berkshire Ave Springfield, MO 65809
Southeast Springfield NeighborhoodEstimated Value: $498,994 - $626,000
5
Beds
3
Baths
3,871
Sq Ft
$142/Sq Ft
Est. Value
About This Home
This home is located at 1940 S Berkshire Ave, Springfield, MO 65809 and is currently estimated at $548,249, approximately $141 per square foot. 1940 S Berkshire Ave is a home located in Greene County with nearby schools including Sequiota Elementary School, Glendale High School, and Springfield Catholic High School.
Ownership History
Date
Name
Owned For
Owner Type
Purchase Details
Closed on
Oct 12, 2021
Sold by
Roberts Virginia L
Bought by
Cardoza John T
Current Estimated Value
Purchase Details
Closed on
May 12, 2021
Sold by
Cardoza John T
Bought by
Cardoza John T and John Thomas Cardoza Revocable Living Trust
Purchase Details
Closed on
Mar 9, 2021
Sold by
Meriweather Amy L
Bought by
Cardoza John T
Purchase Details
Closed on
Jun 30, 2008
Sold by
Nash M Elizabeth
Bought by
Cardoza John T and Meriweather Amy
Home Financials for this Owner
Home Financials are based on the most recent Mortgage that was taken out on this home.
Original Mortgage
$216,000
Interest Rate
5.99%
Mortgage Type
New Conventional
Create a Home Valuation Report for This Property
The Home Valuation Report is an in-depth analysis detailing your home's value as well as a comparison with similar homes in the area
Home Values in the Area
Average Home Value in this Area
Purchase History
| Date | Buyer | Sale Price | Title Company |
|---|---|---|---|
| Cardoza John T | -- | None Listed On Document | |
| Cardoza John T | -- | None Listed On Document | |
| Cardoza John T | -- | None Listed On Document | |
| Cardoza John T | -- | None Available | |
| Cardoza John T | -- | None Listed On Document | |
| Cardoza John T | -- | None Available |
Source: Public Records
Mortgage History
| Date | Status | Borrower | Loan Amount |
|---|---|---|---|
| Previous Owner | Cardoza John T | $216,000 |
Source: Public Records
Tax History Compared to Growth
Tax History
| Year | Tax Paid | Tax Assessment Tax Assessment Total Assessment is a certain percentage of the fair market value that is determined by local assessors to be the total taxable value of land and additions on the property. | Land | Improvement |
|---|---|---|---|---|
| 2025 | $3,514 | $68,740 | $7,600 | $61,140 |
| 2024 | $3,514 | $63,120 | $4,750 | $58,370 |
| 2023 | $3,337 | $63,120 | $4,750 | $58,370 |
| 2022 | $3,197 | $58,900 | $4,750 | $54,150 |
| 2021 | $3,197 | $58,900 | $4,750 | $54,150 |
| 2020 | $3,099 | $54,440 | $4,750 | $49,690 |
| 2019 | $3,013 | $54,440 | $4,750 | $49,690 |
| 2018 | $2,676 | $48,360 | $3,800 | $44,560 |
| 2017 | $2,649 | $46,650 | $3,800 | $42,850 |
| 2016 | $2,556 | $46,650 | $3,800 | $42,850 |
| 2015 | $2,536 | $46,650 | $3,800 | $42,850 |
| 2014 | $2,336 | $44,760 | $3,800 | $40,960 |
Source: Public Records
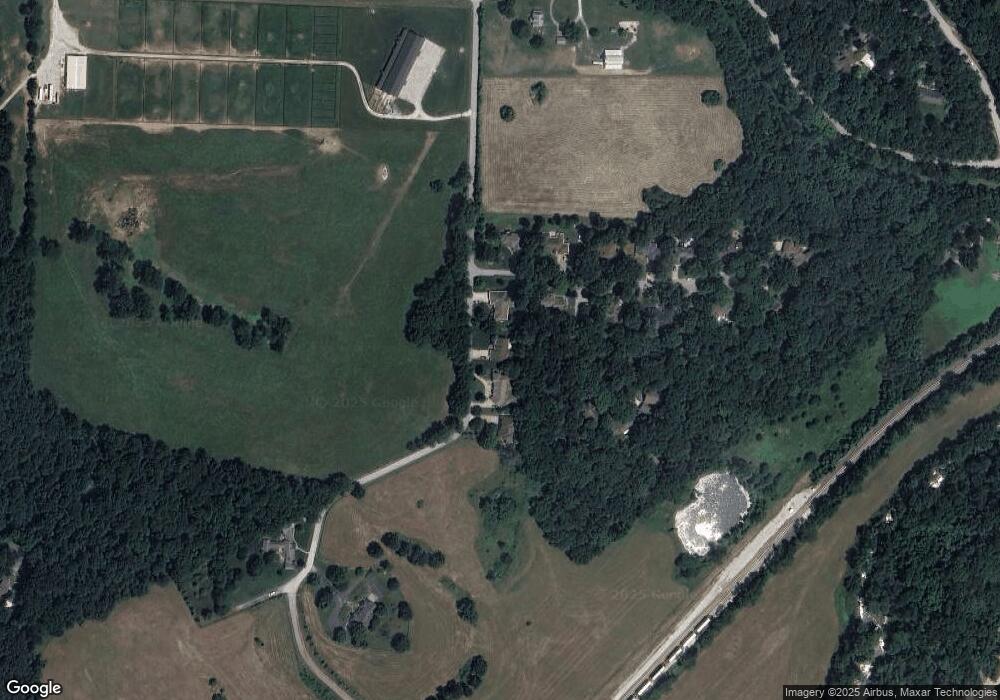
Map
Nearby Homes
- 1950 S Farm Road 199
- 1410 S Briar Ave
- Tract 3 S Farm Road 199
- 5757 E Meadowmere St
- 5116 E Crown Park Ln
- 1318 S Farm Road 205
- 5854 E Sumac Ln
- 5147 E Crown Park Ln
- 2149 S Cedar Hill Ave
- 4833 E Eastmoor St
- Lot 12 S Markham Ct
- 2173 S Pin Oak Dr
- 6431 E Ridgeline Dr
- 6298 E Summit View Dr
- 000 S Farm Road 197
- 2034 S Emerald Place
- 927 S Farm Road 197
- 5295 E Farm Road 138
- 4286 E Latoka St
- 4681 E Stonebrook Ct
- 1954 S Berkshire Ave
- 1926 S Berkshire Ave
- 5622 E Eastmore Dr
- 2000 S Berkshire Ave
- 1953 S River Ave
- 1926 S River Ave
- 5611 E Eastmore Dr
- 5625 E Eastmore Dr
- 1940 S River Ave
- 5639 E Eastmore Dr
- 1954 S River Ave
- 1952 S River Ave
- 5664 E Eastmore Dr
- 5653 E Eastmore Dr
- 5667 E Eastmore Dr
- 5714 E Eastmore Dr
- 5713 E Eastmore Dr
- 5722 E Eastmore Dr
- 2140 S Berkshire Ave
- 0 State Hwy J - East Side Unit 60051008