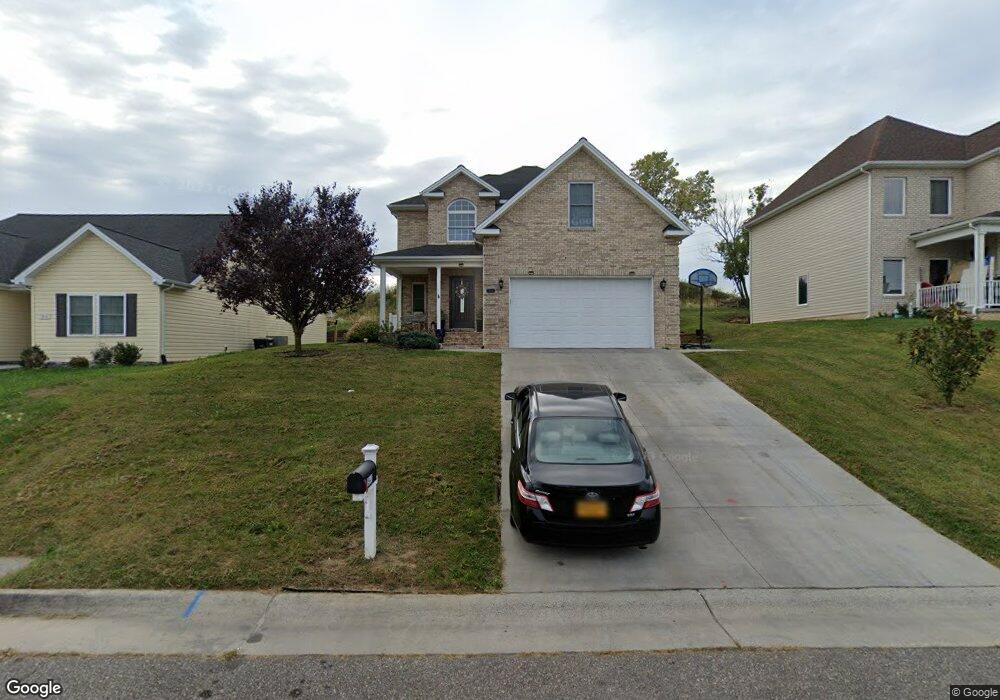
1941 Russell Dr Harrisonburg, VA 22801
Estimated Value: $379,000 - $439,000
4
Beds
3
Baths
1,750
Sq Ft
$230/Sq Ft
Est. Value
About This Home
This home is located at 1941 Russell Dr, Harrisonburg, VA 22801 and is currently estimated at $403,328, approximately $230 per square foot. 1941 Russell Dr is a home located in Harrisonburg City with nearby schools including Bluestone Elementary, Thomas Harrison Middle School, and Harrisonburg High School.
Ownership History
Date
Name
Owned For
Owner Type
Purchase Details
Closed on
Jul 11, 2019
Sold by
Mullins Ryan W and Mullins Hannah Y
Bought by
Mirza Sean and Jabari Fatima
Current Estimated Value
Home Financials for this Owner
Home Financials are based on the most recent Mortgage that was taken out on this home.
Original Mortgage
$188,000
Outstanding Balance
$164,624
Interest Rate
3.9%
Mortgage Type
New Conventional
Estimated Equity
$238,704
Purchase Details
Closed on
Oct 18, 2016
Sold by
Troyer Freeman R
Bought by
Mullins Ryan W and Mullins Hannah Y
Home Financials for this Owner
Home Financials are based on the most recent Mortgage that was taken out on this home.
Original Mortgage
$239,900
Interest Rate
3.42%
Mortgage Type
VA
Purchase Details
Closed on
Jan 17, 2007
Sold by
Diversified Properties Llc
Bought by
Troyer Freeman R
Create a Home Valuation Report for This Property
The Home Valuation Report is an in-depth analysis detailing your home's value as well as a comparison with similar homes in the area
Home Values in the Area
Average Home Value in this Area
Purchase History
| Date | Buyer | Sale Price | Title Company |
|---|---|---|---|
| Mirza Sean | $270,000 | Stewart Title Guaranty Co | |
| Mullins Ryan W | $239,900 | Stewart Title Guaranty Co | |
| Troyer Freeman R | -- | None Available |
Source: Public Records
Mortgage History
| Date | Status | Borrower | Loan Amount |
|---|---|---|---|
| Open | Mirza Sean | $188,000 | |
| Previous Owner | Mullins Ryan W | $239,900 |
Source: Public Records
Tax History Compared to Growth
Tax History
| Year | Tax Paid | Tax Assessment Tax Assessment Total Assessment is a certain percentage of the fair market value that is determined by local assessors to be the total taxable value of land and additions on the property. | Land | Improvement |
|---|---|---|---|---|
| 2025 | $3,459 | $350,500 | $52,000 | $298,500 |
| 2024 | $3,459 | $342,500 | $52,000 | $290,500 |
| 2023 | $0 | $315,300 | $52,000 | $263,300 |
| 2022 | $0 | $289,600 | $52,000 | $237,600 |
| 2021 | $2,297 | $255,200 | $45,000 | $210,200 |
| 2020 | $2,038 | $233,500 | $40,000 | $193,500 |
| 2019 | $2,038 | $233,500 | $40,000 | $193,500 |
| 2018 | $1,636 | $228,800 | $40,000 | $188,800 |
| 2017 | $1,636 | $227,200 | $40,000 | $187,200 |
| 2016 | $1,636 | $227,200 | $40,000 | $187,200 |
| 2015 | $1,636 | $227,200 | $40,000 | $187,200 |
| 2014 | -- | $232,200 | $45,000 | $187,200 |
Source: Public Records
Map
Nearby Homes
- 2020 Shoeshine Ave
- 550 Grommet Dr
- 745 Wingtip Way
- 2102 Willow Hill Dr
- 2112 Willow Hill Dr
- 1739 Kingston Ct
- 2105 Willow Hill Dr
- 2122 Willow Hill Dr
- 2132 Willow Hill Dr
- 210 W Mosby Rd
- 2414 Millwood Loop Unit 15
- 521 Hickory Grove Cir
- 52 South Ave Unit G
- 44 South Ave Unit G
- 1435 Bluestone St
- 655 Greenwood St
- 1450 Bluestone St
- 3346 White Oak Dr
- 3345 Redbud Ln
- 100 Monument Ave
- 1931 Russell Dr
- 1951 Russell Dr
- 0 Russell Dr Unit 183558
- 0 Russell Dr Unit 183549
- 0 Russell Dr Unit 183541
- 0 Russell Dr Unit 183560
- 0 Russell Dr Unit 183559
- 1921 Russell Dr
- 1961 Russell Dr
- 1940 Russell Dr
- 1930 Russell Dr
- 685 Pear St
- 0 Starlight Ct Unit 183538
- 0 Starlight Ct Unit 532229
- 1971 Russell Dr
- 670 Starlight Ct
- 681 Starlight Ct
- 660 Bartlett Ct
- 1966 Russell Dr
- 685 Bartlett Ct