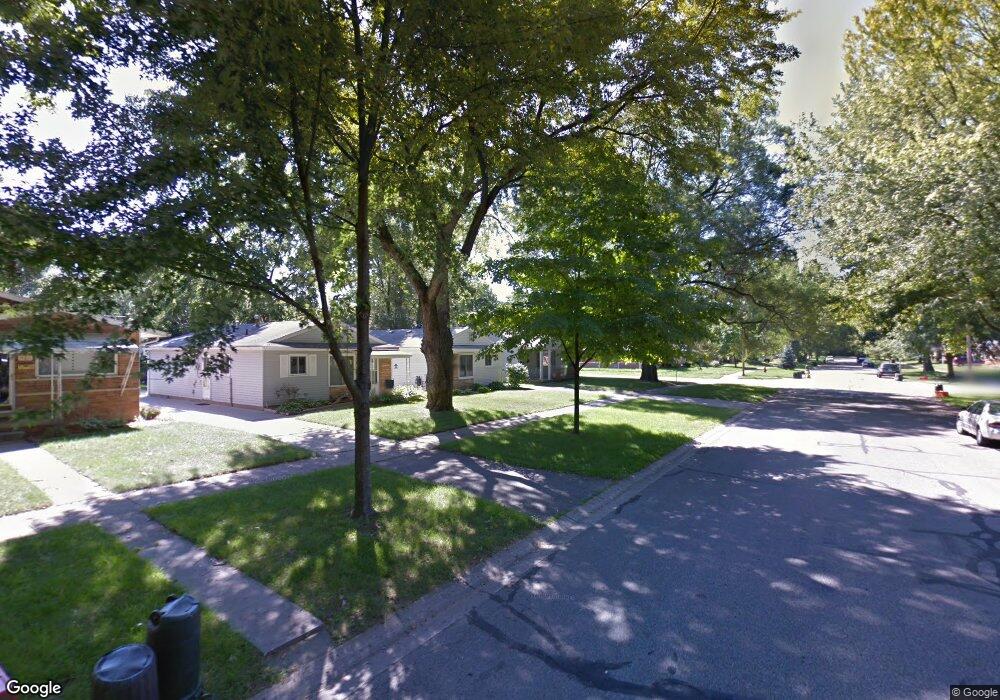
19414 Saint Francis St Livonia, MI 48152
Estimated Value: $179,000 - $197,000
3
Beds
1
Bath
1,000
Sq Ft
$187/Sq Ft
Est. Value
About This Home
This home is located at 19414 Saint Francis St, Livonia, MI 48152 and is currently estimated at $186,680, approximately $186 per square foot. 19414 Saint Francis St is a home located in Wayne County with nearby schools including Clarenceville High School, David Ellis Academy West, and Grand River Academy.
Ownership History
Date
Name
Owned For
Owner Type
Purchase Details
Closed on
Oct 30, 2008
Sold by
Hernes Tymeka
Bought by
Deutsche Bank National Trust Company and Novastar Mortgage Funding Trust Series 2
Current Estimated Value
Purchase Details
Closed on
Dec 26, 2006
Sold by
Slack Joan C
Bought by
Hernes Tymeka L
Purchase Details
Closed on
Jul 15, 2004
Sold by
May Mary K and May Matthew T
Bought by
Slack Joan C
Purchase Details
Closed on
Dec 4, 2003
Sold by
May Mary K and Fyke Mary
Bought by
May Matthew T
Purchase Details
Closed on
Feb 1, 2001
Sold by
Epstein Deena
Bought by
Fyke Mary
Home Financials for this Owner
Home Financials are based on the most recent Mortgage that was taken out on this home.
Original Mortgage
$94,500
Interest Rate
7.18%
Purchase Details
Closed on
Oct 30, 2000
Sold by
Jurado Edith
Bought by
Epstein Norman A
Purchase Details
Closed on
May 31, 2000
Sold by
Kulkarni Kamini S
Bought by
Jurado Francisco
Create a Home Valuation Report for This Property
The Home Valuation Report is an in-depth analysis detailing your home's value as well as a comparison with similar homes in the area
Home Values in the Area
Average Home Value in this Area
Purchase History
| Date | Buyer | Sale Price | Title Company |
|---|---|---|---|
| Deutsche Bank National Trust Company | $34,000 | None Available | |
| Hernes Tymeka L | $120,000 | Multiple | |
| Slack Joan C | $120,000 | Multiple | |
| May Matthew T | -- | First American Title | |
| Fyke Mary | $105,000 | -- | |
| Epstein Norman A | $82,500 | -- | |
| Jurado Francisco | $30,000 | -- |
Source: Public Records
Mortgage History
| Date | Status | Borrower | Loan Amount |
|---|---|---|---|
| Previous Owner | Fyke Mary | $94,500 |
Source: Public Records
Tax History Compared to Growth
Tax History
| Year | Tax Paid | Tax Assessment Tax Assessment Total Assessment is a certain percentage of the fair market value that is determined by local assessors to be the total taxable value of land and additions on the property. | Land | Improvement |
|---|---|---|---|---|
| 2025 | $1,396 | $80,900 | $0 | $0 |
| 2024 | $1,396 | $72,400 | $0 | $0 |
| 2023 | $2,287 | $65,200 | $0 | $0 |
| 2022 | $1,773 | $58,900 | $0 | $0 |
| 2021 | $1,722 | $55,500 | $0 | $0 |
| 2020 | $1,703 | $53,200 | $0 | $0 |
| 2019 | $1,675 | $48,500 | $0 | $0 |
| 2018 | $2,046 | $45,000 | $0 | $0 |
| 2017 | $395 | $41,700 | $0 | $0 |
| 2016 | $1,737 | $41,700 | $0 | $0 |
| 2015 | $3,099 | $37,110 | $0 | $0 |
| 2012 | -- | $33,270 | $10,700 | $22,570 |
Source: Public Records
Map
Nearby Homes
- 19499 Saint Francis St
- 19435 Inkster Rd
- 19661 Antago St
- 19424 Inkster Rd
- 19169 Inkster Rd
- 19643 Inkster Rd
- 19701 Seminole
- 19783 Poinciana
- 19493 Negaunee
- 19904 Seminole
- 18913 Gillman St
- 18884 Lathers St
- 19800 Poinciana
- 19816 Poinciana
- 27440 Fargo St
- 18851 Poinciana
- 18570 Pershing St
- 20159 Deering St
- 19925 Negaunee
- 20135 Saint Francis St
- 19418 Saint Francis St
- 19384 Saint Francis St
- 19403 Antago St
- 19426 Saint Francis St
- 19411 Antago St
- 19378 Saint Francis St
- 19419 Antago St
- 19389 Antago St
- 19434 Saint Francis St
- 19427 Antago St
- 19372 Saint Francis St
- 19383 Antago St
- 19403 Saint Francis St
- 19442 Saint Francis St
- 19435 Antago St
- 19411 Saint Francis St
- 19366 Saint Francis St
- 19419 Saint Francis St
- 19377 Antago St
- 19385 Saint Francis St