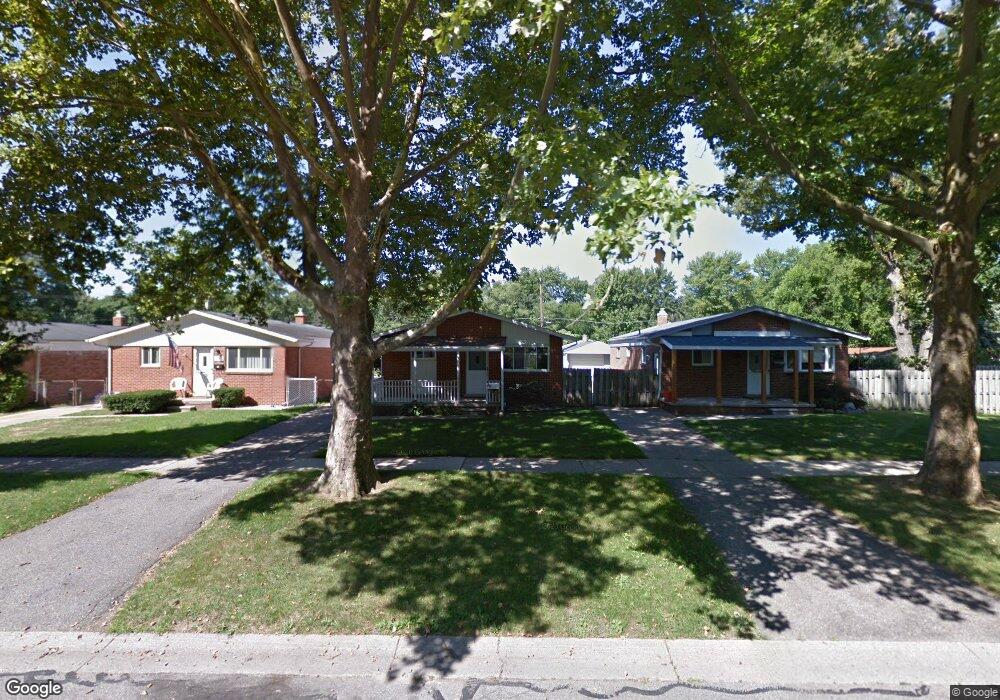
19475 Saint Francis St Livonia, MI 48152
Estimated Value: $168,000 - $207,000
3
Beds
1
Bath
988
Sq Ft
$195/Sq Ft
Est. Value
About This Home
This home is located at 19475 Saint Francis St, Livonia, MI 48152 and is currently estimated at $192,796, approximately $195 per square foot. 19475 Saint Francis St is a home located in Wayne County with nearby schools including Clarenceville High School, Grand River Academy, and Concordia Lutheran School.
Ownership History
Date
Name
Owned For
Owner Type
Purchase Details
Closed on
Mar 31, 2011
Sold by
Federal Home Loan Mortgage Corporation
Bought by
Mcintosh Ethan S and Mcintosh Terry L
Current Estimated Value
Home Financials for this Owner
Home Financials are based on the most recent Mortgage that was taken out on this home.
Original Mortgage
$43,956
Outstanding Balance
$30,495
Interest Rate
4.92%
Mortgage Type
FHA
Estimated Equity
$162,301
Purchase Details
Closed on
Dec 20, 2010
Sold by
Laslett Gus W and Laslett Nicole
Bought by
Federal Home Loan Mortgage Corp
Purchase Details
Closed on
Nov 3, 2010
Sold by
Laslett Gus and Laslett Nicole
Bought by
Federal Home Loan Mortgage Corp
Purchase Details
Closed on
Jun 2, 2005
Sold by
Sheetz Jeffry L and Sheetz Kathleen R
Bought by
Laslett Gus
Home Financials for this Owner
Home Financials are based on the most recent Mortgage that was taken out on this home.
Original Mortgage
$140,000
Interest Rate
5.12%
Mortgage Type
Fannie Mae Freddie Mac
Create a Home Valuation Report for This Property
The Home Valuation Report is an in-depth analysis detailing your home's value as well as a comparison with similar homes in the area
Home Values in the Area
Average Home Value in this Area
Purchase History
| Date | Buyer | Sale Price | Title Company |
|---|---|---|---|
| Mcintosh Ethan S | $45,100 | Attorneys Title Agency Llc | |
| Federal Home Loan Mortgage Corp | $3,500 | Attorneys Title Agency Llc | |
| Federal Home Loan Mortgage Corp | $41,400 | None Available | |
| Laslett Gus | $156,500 | First American Title |
Source: Public Records
Mortgage History
| Date | Status | Borrower | Loan Amount |
|---|---|---|---|
| Open | Mcintosh Ethan S | $43,956 | |
| Previous Owner | Laslett Gus | $140,000 |
Source: Public Records
Tax History Compared to Growth
Tax History
| Year | Tax Paid | Tax Assessment Tax Assessment Total Assessment is a certain percentage of the fair market value that is determined by local assessors to be the total taxable value of land and additions on the property. | Land | Improvement |
|---|---|---|---|---|
| 2025 | $889 | $90,900 | $0 | $0 |
| 2024 | $889 | $82,800 | $0 | $0 |
| 2023 | $850 | $74,200 | $0 | $0 |
| 2022 | $1,412 | $67,100 | $0 | $0 |
| 2021 | $1,374 | $63,500 | $0 | $0 |
| 2019 | $1,339 | $56,500 | $0 | $0 |
| 2018 | $3,655 | $53,600 | $0 | $0 |
| 2017 | $682 | $45,800 | $0 | $0 |
| 2016 | $1,247 | $45,600 | $0 | $0 |
| 2015 | $3,282 | $40,560 | $0 | $0 |
| 2012 | -- | $36,570 | $9,200 | $27,370 |
Source: Public Records
Map
Nearby Homes
- 19499 Saint Francis St
- 19661 Antago St
- 19435 Inkster Rd
- 19424 Inkster Rd
- 19643 Inkster Rd
- 19701 Seminole
- 19169 Inkster Rd
- 19783 Poinciana
- 19904 Seminole
- 19493 Negaunee
- 27440 Fargo St
- 19800 Poinciana
- 19816 Poinciana
- 20159 Deering St
- 20135 Saint Francis St
- 27725 Norfolk St
- 18913 Gillman St
- 18884 Lathers St
- 19925 Negaunee
- 18851 Poinciana
- 19483 Saint Francis St
- 19467 Saint Francis St
- 19487 Saint Francis St
- 19459 Saint Francis St
- 19472 Deering St
- 19464 Deering St
- 19488 Deering St
- 19456 Deering St
- 19443 Saint Francis St
- 19448 Deering St
- 19496 Deering St
- 19435 Saint Francis St
- 19440 Deering St
- 19474 Saint Francis St
- 19482 Saint Francis St
- 19466 Saint Francis St
- 19490 Saint Francis St
- 19458 Saint Francis St
- 19498 Saint Francis St
- 19434 Deering St