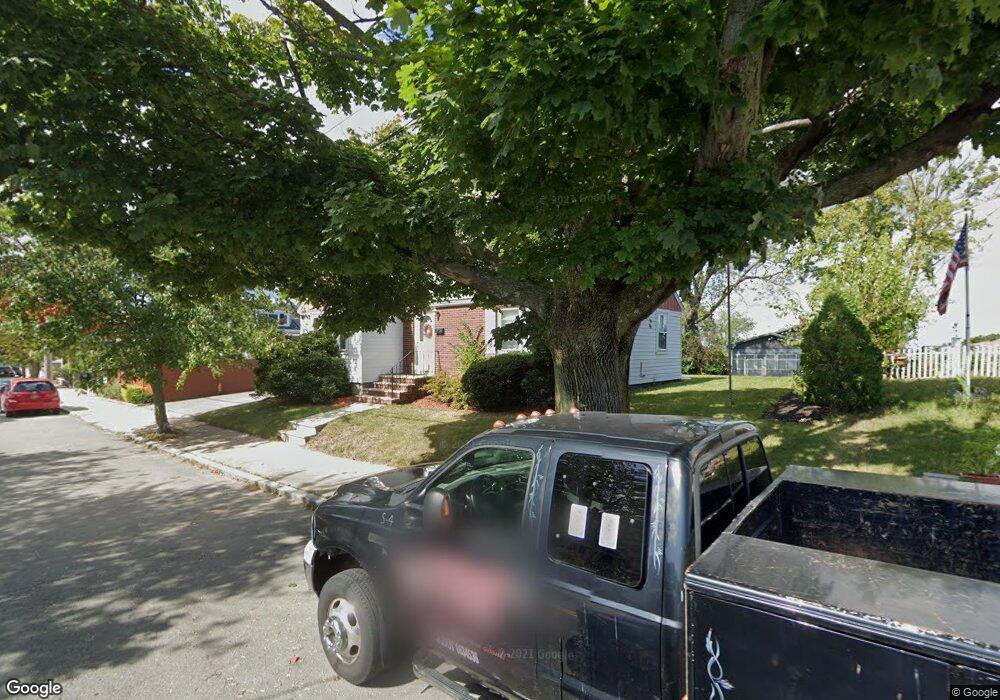
195 Orient Ave Boston, MA 02128
Harbor View-Orient Heights NeighborhoodEstimated Value: $739,000 - $842,000
2
Beds
1
Bath
1,372
Sq Ft
$565/Sq Ft
Est. Value
About This Home
This home is located at 195 Orient Ave, Boston, MA 02128 and is currently estimated at $775,704, approximately $565 per square foot. 195 Orient Ave is a home located in Suffolk County with nearby schools including Excel Academy East Boston, East Boston Montessori School, and Brooke Charter Schools East Boston.
Ownership History
Date
Name
Owned For
Owner Type
Purchase Details
Closed on
Oct 22, 2025
Sold by
Costigan Christopher
Bought by
Christopher Costigan Lt and Costigan
Current Estimated Value
Purchase Details
Closed on
Jul 28, 2011
Sold by
Giardina James V
Bought by
Costiga Christopher
Home Financials for this Owner
Home Financials are based on the most recent Mortgage that was taken out on this home.
Original Mortgage
$260,000
Interest Rate
4.58%
Purchase Details
Closed on
Sep 26, 2007
Sold by
Scandurra Vincent R Es and Scandurra Plotnick
Bought by
Giardina James V
Home Financials for this Owner
Home Financials are based on the most recent Mortgage that was taken out on this home.
Original Mortgage
$310,000
Interest Rate
6.65%
Mortgage Type
Purchase Money Mortgage
Purchase Details
Closed on
Aug 8, 2003
Sold by
Ricupiero Patricia A
Bought by
Gover Timothy P and Gover Kathleen
Create a Home Valuation Report for This Property
The Home Valuation Report is an in-depth analysis detailing your home's value as well as a comparison with similar homes in the area
Home Values in the Area
Average Home Value in this Area
Purchase History
| Date | Buyer | Sale Price | Title Company |
|---|---|---|---|
| Christopher Costigan Lt | -- | -- | |
| Costiga Christopher | $335,000 | -- | |
| Costiga Christopher | $335,000 | -- | |
| Giardina James V | $310,000 | -- | |
| Giardina James V | $310,000 | -- | |
| Gover Timothy P | $55,000 | -- | |
| Gover Timothy P | $55,000 | -- |
Source: Public Records
Mortgage History
| Date | Status | Borrower | Loan Amount |
|---|---|---|---|
| Previous Owner | Gover Timothy P | $260,000 | |
| Previous Owner | Costiga Christopher | $260,000 | |
| Previous Owner | Giardina James V | $310,000 |
Source: Public Records
Tax History Compared to Growth
Tax History
| Year | Tax Paid | Tax Assessment Tax Assessment Total Assessment is a certain percentage of the fair market value that is determined by local assessors to be the total taxable value of land and additions on the property. | Land | Improvement |
|---|---|---|---|---|
| 2025 | $8,399 | $725,300 | $275,900 | $449,400 |
| 2024 | $7,711 | $707,400 | $237,900 | $469,500 |
| 2023 | $7,102 | $661,300 | $222,400 | $438,900 |
| 2022 | $6,985 | $642,000 | $215,900 | $426,100 |
| 2021 | $6,850 | $642,000 | $215,900 | $426,100 |
| 2020 | $5,121 | $484,900 | $217,100 | $267,800 |
| 2019 | $4,563 | $432,900 | $160,100 | $272,800 |
| 2018 | $4,124 | $393,500 | $160,100 | $233,400 |
| 2017 | $3,789 | $357,800 | $160,100 | $197,700 |
| 2016 | $3,936 | $357,800 | $160,100 | $197,700 |
| 2015 | $4,018 | $331,800 | $134,200 | $197,600 |
| 2014 | $3,794 | $301,600 | $134,200 | $167,400 |
Source: Public Records
Map
Nearby Homes
- 188 Gladstone St Unit 1
- 36A Leyden St
- 16 Boardman St Unit 105
- 1030 Bennington St Unit 15
- 92 Waldemar Ave
- 49 Faywood Ave
- 1044 Saratoga St Unit 1
- 29 St Andrew Rd Unit 1
- 1203 Bennington St
- 125 Addison St Unit 309
- 125 Addison St Unit 102
- 125 Addison St Unit 207
- 125 Addison St Unit 8
- 443 Bennington St
- 795 Saratoga St
- 95 Addison St Unit 206
- 95 Addison St Unit PH7
- 95 Addison St Unit A
- 31 Wordsworth St
- 177 Cowper St
- 195 Orient Ave Unit 1
- 191 Orient Ave
- 205 Orient Ave
- 33 Montmorenci Ave
- 37 Montmorenci Ave
- 187 Orient Ave
- 29 Montmorenci Ave
- 41 Montmorenci Ave
- 202 Orient Ave
- 202 Orient Ave Unit 2
- 202 Orient Ave
- 202 Orient Ave Unit 1
- 198 Orient Ave
- 194 Orient Ave
- 215 Orient Ave
- 215 Orient Ave Unit 1
- 183 Orient Ave
- 43 Montmorenci Ave
- 206 Orient Ave
- 186 Orient Ave