1950 N Ellicott Hwy Calhan, CO 80808
Estimated Value: $401,000 - $495,000
3
Beds
1
Bath
10,652
Sq Ft
$42/Sq Ft
Est. Value
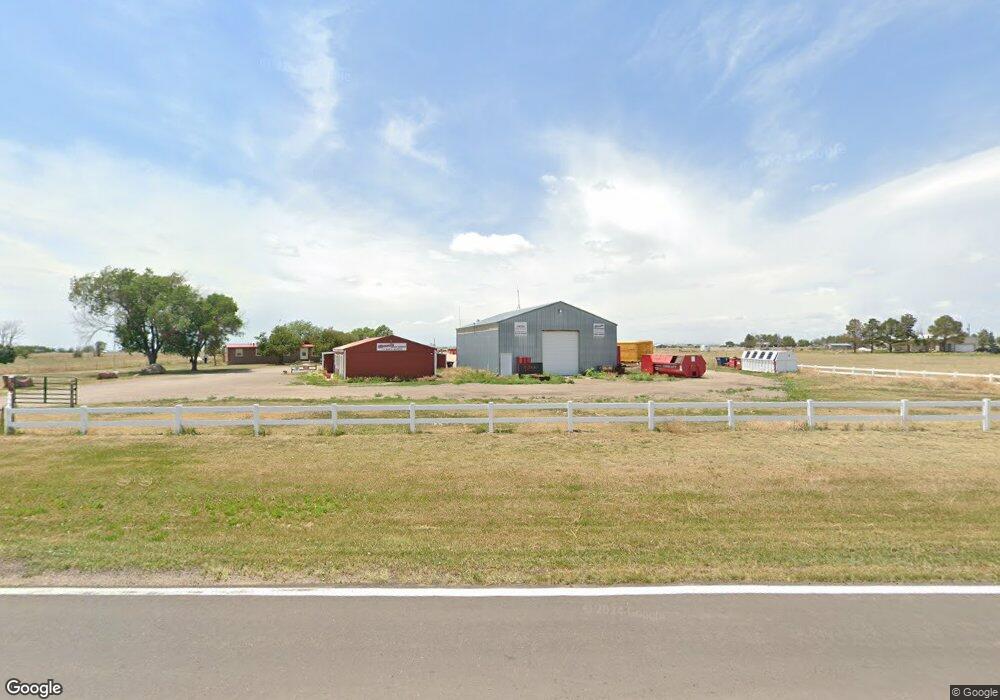
About This Home
This home is located at 1950 N Ellicott Hwy, Calhan, CO 80808 and is currently estimated at $448,000, approximately $42 per square foot. 1950 N Ellicott Hwy is a home located in El Paso County with nearby schools including Ellicott Elementary School, Ellicott Middle School, and Ellicott Senior High School.
Ownership History
Date
Name
Owned For
Owner Type
Purchase Details
Closed on
Jan 6, 2020
Sold by
Gariner Renate
Bought by
Vetrano Reanna and Vetrano Ellena
Current Estimated Value
Purchase Details
Closed on
Sep 22, 2016
Sold by
Vetrano Ronald
Bought by
Gernier Renato
Purchase Details
Closed on
Dec 15, 2009
Sold by
Vetrano Renate
Bought by
Vetrano Renate
Purchase Details
Closed on
Mar 13, 1996
Sold by
Spillman Carol L
Bought by
Vetrano Daniel A
Home Financials for this Owner
Home Financials are based on the most recent Mortgage that was taken out on this home.
Original Mortgage
$45,200
Interest Rate
4%
Mortgage Type
Seller Take Back
Purchase Details
Closed on
Feb 26, 1996
Sold by
Middlestadt James
Bought by
Spillman Carol L
Home Financials for this Owner
Home Financials are based on the most recent Mortgage that was taken out on this home.
Original Mortgage
$45,200
Interest Rate
4%
Mortgage Type
Seller Take Back
Create a Home Valuation Report for This Property
The Home Valuation Report is an in-depth analysis detailing your home's value as well as a comparison with similar homes in the area
Home Values in the Area
Average Home Value in this Area
Purchase History
| Date | Buyer | Sale Price | Title Company |
|---|---|---|---|
| Vetrano Reanna | -- | None Available | |
| Gernier Renato | -- | None Available | |
| Vetrano Renate | -- | None Available | |
| Vetrano Daniel A | -- | -- | |
| Spillman Carol L | -- | -- | |
| Spillman Carol L | -- | -- |
Source: Public Records
Mortgage History
| Date | Status | Borrower | Loan Amount |
|---|---|---|---|
| Previous Owner | Vetrano Daniel A | $45,200 |
Source: Public Records
Tax History Compared to Growth
Tax History
| Year | Tax Paid | Tax Assessment Tax Assessment Total Assessment is a certain percentage of the fair market value that is determined by local assessors to be the total taxable value of land and additions on the property. | Land | Improvement |
|---|---|---|---|---|
| 2025 | $995 | $74,970 | -- | -- |
| 2024 | $829 | $30,250 | $15,630 | $14,620 |
| 2023 | $829 | $30,250 | $15,630 | $14,620 |
| 2022 | $1,419 | $26,070 | $12,900 | $13,170 |
| 2021 | $1,310 | $26,290 | $12,950 | $13,340 |
| 2020 | $1,336 | $25,310 | $11,340 | $13,970 |
| 2019 | $1,324 | $25,310 | $11,340 | $13,970 |
| 2018 | $1,621 | $29,770 | $11,350 | $18,420 |
| 2017 | $1,767 | $29,770 | $11,350 | $18,420 |
| 2016 | $1,707 | $28,530 | $11,510 | $17,020 |
| 2015 | $1,699 | $28,530 | $11,510 | $17,020 |
| 2014 | $2,715 | $27,870 | $11,510 | $16,360 |
Source: Public Records
Map
Nearby Homes
- 2202 N Ellicott Hwy
- 0 N Ellicott Hwy
- 23245 Colorado 94 Unit 291
- 24515 Big Springs Rd
- 22313 Cattlemen Run
- 24615 Big Springs Rd
- 22289 Cattlemen Run
- 443 Galveston Terrace
- 485 Galveston Terrace
- 471 Galveston Terrace
- 491 Blanket Flower St
- 407 Blanket Flower St
- 22036 Cattlemen Run
- 411 Indian Grass St
- 25532 Big Springs Rd
- 471 Atchison Way
- 2020 N Ellicott Hwy
- 1925 N Ellicott Hwy
- 2015 N Ellicott Hwy
- 2255 N Ellicott Hwy
- 1660 N Ellicott Hwy
- 23590 Mcdaniels Rd
- 1750 N Ellicott Hwy
- 2175 N Ellicott Hwy
- 1580 N Ellicott Hwy
- 2495 N Ellicott Hwy
- 23315 Bunny View Unit 7
- 22980 Mcdaniels Rd
- 1525 N Ellicott Hwy
- 1540 N Ellicott Hwy
- 23480 Mcdaniels Rd
- 1450 N Ellicott Hwy
- 2503 N Ellicott Hwy
- 1395 N Ellicott Hwy
- 23905 Mcdaniels Rd
- 23555 Mcdaniels Rd