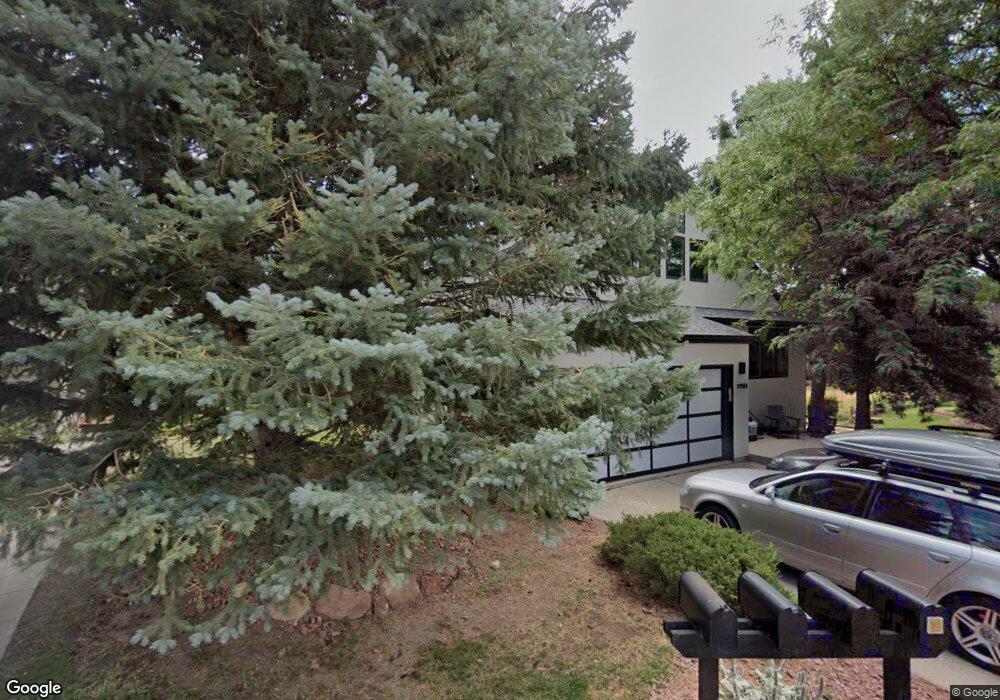
1950 Tincup Ct Boulder, CO 80305
Table Mesa NeighborhoodEstimated Value: $1,696,098 - $2,125,000
4
Beds
3
Baths
2,338
Sq Ft
$805/Sq Ft
Est. Value
About This Home
This home is located at 1950 Tincup Ct, Boulder, CO 80305 and is currently estimated at $1,881,775, approximately $804 per square foot. 1950 Tincup Ct is a home located in Boulder County with nearby schools including Mesa Elementary School, Southern Hills Middle School, and Fairview High School.
Ownership History
Date
Name
Owned For
Owner Type
Purchase Details
Closed on
Nov 24, 2010
Sold by
Norse Edmond Thomas and Jones Linda Ann
Bought by
Norse Edmond T
Current Estimated Value
Home Financials for this Owner
Home Financials are based on the most recent Mortgage that was taken out on this home.
Original Mortgage
$290,450
Outstanding Balance
$191,146
Interest Rate
4.22%
Mortgage Type
New Conventional
Estimated Equity
$1,690,629
Purchase Details
Closed on
Apr 28, 2006
Sold by
Fernie John C and Fernie Barbara V
Bought by
Norse Edmond Thomas and Jones Linda Ann
Home Financials for this Owner
Home Financials are based on the most recent Mortgage that was taken out on this home.
Original Mortgage
$300,000
Interest Rate
6.33%
Mortgage Type
Fannie Mae Freddie Mac
Purchase Details
Closed on
Jul 17, 1991
Bought by
Norse Edmond T and Jones Linda Ann
Purchase Details
Closed on
Mar 29, 1988
Bought by
Norse Edmond T and Jones Linda Ann
Purchase Details
Closed on
May 2, 1985
Bought by
Norse Edmond T and Jones Linda Ann
Purchase Details
Closed on
Jan 6, 1984
Bought by
Norse Edmond T and Jones Linda Ann
Create a Home Valuation Report for This Property
The Home Valuation Report is an in-depth analysis detailing your home's value as well as a comparison with similar homes in the area
Home Values in the Area
Average Home Value in this Area
Purchase History
| Date | Buyer | Sale Price | Title Company |
|---|---|---|---|
| Norse Edmond T | -- | Heritage Title | |
| Norse Edmond Thomas | $900,000 | Utc Colorado | |
| Norse Edmond T | $300,000 | -- | |
| Norse Edmond T | $72,000 | -- | |
| Norse Edmond T | $202,200 | -- | |
| Norse Edmond T | -- | -- |
Source: Public Records
Mortgage History
| Date | Status | Borrower | Loan Amount |
|---|---|---|---|
| Open | Norse Edmond T | $290,450 | |
| Closed | Norse Edmond Thomas | $300,000 |
Source: Public Records
Tax History Compared to Growth
Tax History
| Year | Tax Paid | Tax Assessment Tax Assessment Total Assessment is a certain percentage of the fair market value that is determined by local assessors to be the total taxable value of land and additions on the property. | Land | Improvement |
|---|---|---|---|---|
| 2025 | $11,070 | $116,938 | $48,475 | $68,463 |
| 2024 | $11,070 | $116,938 | $48,475 | $68,463 |
| 2023 | $10,878 | $125,967 | $56,401 | $73,251 |
| 2022 | $10,238 | $110,248 | $43,841 | $66,407 |
| 2021 | $9,763 | $113,420 | $45,102 | $68,318 |
| 2020 | $7,478 | $85,907 | $43,186 | $42,721 |
| 2019 | $7,363 | $85,907 | $43,186 | $42,721 |
| 2018 | $6,652 | $76,723 | $41,400 | $35,323 |
| 2017 | $6,444 | $84,822 | $45,770 | $39,052 |
| 2016 | $6,121 | $70,709 | $36,059 | $34,650 |
| 2015 | $5,796 | $63,410 | $27,144 | $36,266 |
| 2014 | $5,332 | $63,410 | $27,144 | $36,266 |
Source: Public Records
Map
Nearby Homes
- 3196 Galena Way
- 3394 Cripple Creek Trail Unit H15
- 3387 Cripple Creek Trail Unit F14
- 3391 Cripple Creek Trail Unit E
- 3433 Cripple Creek Square Unit G16
- 2665 Juilliard St
- 3630 Silver Plume Ln
- 3760 Smuggler Place
- 1535 Findlay Way
- 3970 Longwood Ave
- 3450 Emerson Ave
- 4238 Greenbriar Blvd
- 4204 Greenbriar Blvd Unit 45
- 1265 Hartford Dr
- 2880 La Grange Cir
- 1120 Hartford Dr
- 2860 Table Mesa Dr
- 4350 Butler Cir
- 4475 Hastings Dr
- 1596 Bradley Dr Unit 105C
- 1940 Tincup Ct
- 1960 Tincup Ct
- 1930 Tincup Ct
- 1926 Lehigh St
- 1970 Tincup Ct
- 3005 Galena Way
- 3015 Galena Way
- 3011 Galena Way
- 3000 Galena Way
- 1920 Tincup Ct
- 1980 Tincup Ct
- 3025 Galena Way
- 1975 Tincup Ct
- 1955 Tincup Ct
- 3010 Galena Way
- 1935 Tincup Ct
- 1990 Tincup Ct
- 3035 Galena Way
- 1915 Tincup Ct
- 3030 Galena Way