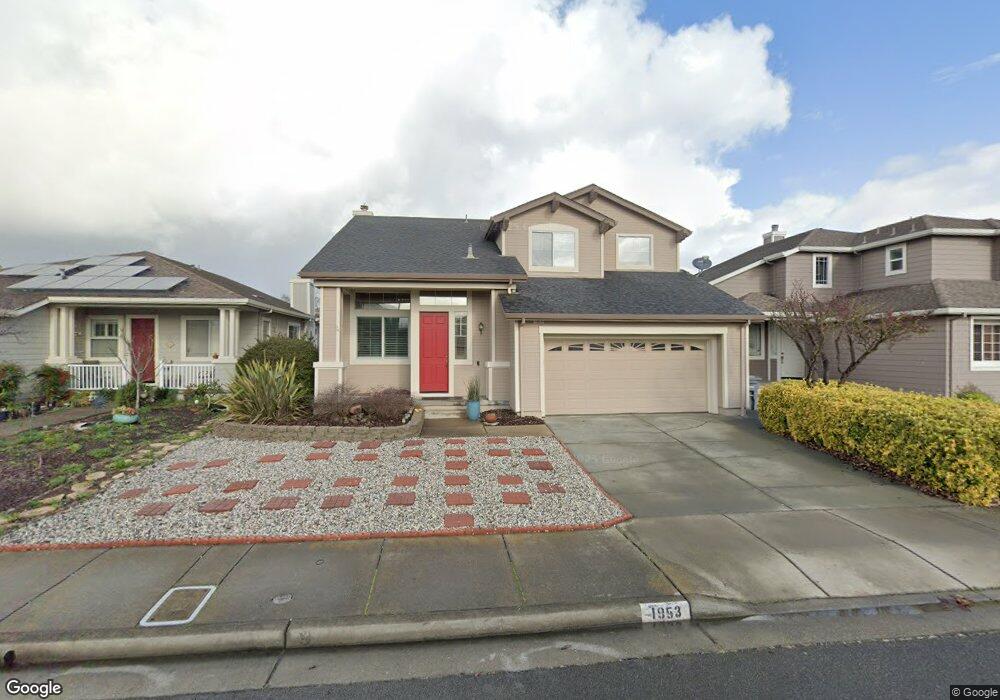
1953 Blue Sky Ln Santa Rosa, CA 95407
Estimated Value: $715,000 - $745,000
5
Beds
3
Baths
2,075
Sq Ft
$352/Sq Ft
Est. Value
About This Home
This home is located at 1953 Blue Sky Ln, Santa Rosa, CA 95407 and is currently estimated at $730,514, approximately $352 per square foot. 1953 Blue Sky Ln is a home located in Sonoma County with nearby schools including Elsie Allen High School and St. Michael's Orthodox School.
Ownership History
Date
Name
Owned For
Owner Type
Purchase Details
Closed on
Aug 6, 2014
Sold by
Lamb Chad A
Bought by
Barri Lamb Benita A
Current Estimated Value
Home Financials for this Owner
Home Financials are based on the most recent Mortgage that was taken out on this home.
Original Mortgage
$282,525
Outstanding Balance
$215,183
Interest Rate
4.08%
Mortgage Type
VA
Estimated Equity
$515,331
Purchase Details
Closed on
Jun 10, 2002
Sold by
Lamb Chad A
Bought by
Barri Lamb Benita A
Purchase Details
Closed on
Dec 30, 1998
Sold by
Bellevue Ranch Associates Llc
Bought by
Lamb Chad A and Barri Lamb Benita A
Home Financials for this Owner
Home Financials are based on the most recent Mortgage that was taken out on this home.
Original Mortgage
$148,000
Interest Rate
6.82%
Create a Home Valuation Report for This Property
The Home Valuation Report is an in-depth analysis detailing your home's value as well as a comparison with similar homes in the area
Home Values in the Area
Average Home Value in this Area
Purchase History
| Date | Buyer | Sale Price | Title Company |
|---|---|---|---|
| Barri Lamb Benita A | -- | First American Title Co | |
| Barri Lamb Benita A | -- | New Century Title Company | |
| Lamb Chad A | $248,500 | North American Title Co |
Source: Public Records
Mortgage History
| Date | Status | Borrower | Loan Amount |
|---|---|---|---|
| Open | Barri Lamb Benita A | $282,525 | |
| Closed | Lamb Chad A | $148,000 |
Source: Public Records
Tax History Compared to Growth
Tax History
| Year | Tax Paid | Tax Assessment Tax Assessment Total Assessment is a certain percentage of the fair market value that is determined by local assessors to be the total taxable value of land and additions on the property. | Land | Improvement |
|---|---|---|---|---|
| 2025 | $4,415 | $388,778 | $101,890 | $286,888 |
| 2024 | $4,415 | $381,156 | $99,893 | $281,263 |
| 2023 | $4,415 | $373,684 | $97,935 | $275,749 |
| 2022 | $4,307 | $366,358 | $96,015 | $270,343 |
| 2021 | $4,260 | $359,176 | $94,133 | $265,043 |
| 2020 | $4,137 | $355,494 | $93,168 | $262,326 |
| 2019 | $4,085 | $348,525 | $91,342 | $257,183 |
| 2018 | $4,050 | $341,692 | $89,551 | $252,141 |
| 2017 | $3,952 | $334,994 | $87,796 | $247,198 |
| 2016 | $3,899 | $328,426 | $86,075 | $242,351 |
| 2015 | $3,774 | $323,494 | $84,783 | $238,711 |
| 2014 | $3,641 | $317,158 | $83,123 | $234,035 |
Source: Public Records
Map
Nearby Homes
- 2630 Arrowhead Dr
- 2632 Wild Bill Way
- 2599 Silver Spur Dr
- 2863 Liscum St
- 2912 Liscum St
- 1461 Trombetta St
- 2931 Liscum St
- Plan 2 at Grove Village
- Plan 4 at Grove Village
- Plan 5 at Grove Village
- Plan 1 at Grove Village
- Plan 6 at Grove Village
- 2766 Sassy St
- 2716 Amora Cir
- 2928 Liscum St
- 2828 Coleman Glen Ln
- 2778 Sassy St
- 2786 Sassy St
- 2790 Sassy St
- 2794 Sassy St
- 1949 Blue Sky Ln
- 1957 Blue Sky Ln
- 2708 Gallop Dr
- 2704 Gallop Dr
- 1961 Blue Sky Ln
- 1945 Blue Sky Ln
- 2700 Gallop Dr
- 2712 Gallop Dr
- 1954 Blue Sky Ln
- 1958 Blue Sky Ln
- 1965 Blue Sky Ln
- 1950 Blue Sky Ln
- 1962 Blue Sky Ln
- 2621 Arrowhead Dr
- 2703 Gallop Dr
- 1966 Blue Sky Ln
- 2705 Gallop Dr
- 2716 Gallop Dr
- 1969 Blue Sky Ln
- 2701 Gallop Dr