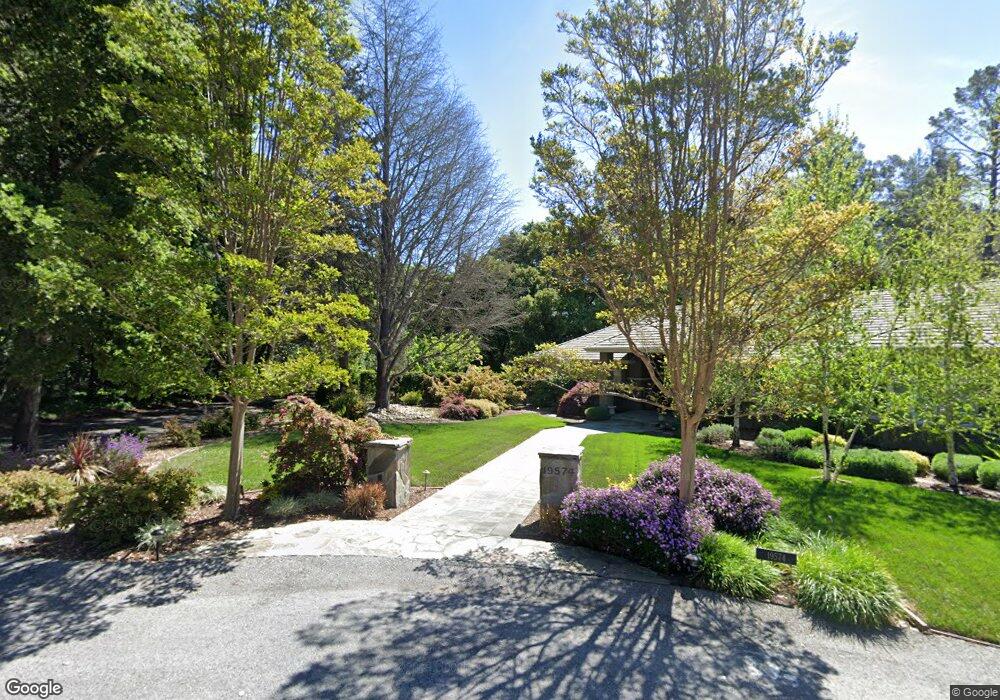
19544 Sky Oaks Way Unit 98 Los Gatos, CA 95030
Glen Una NeighborhoodEstimated Value: $3,404,000 - $3,917,000
4
Beds
3
Baths
2,725
Sq Ft
$1,308/Sq Ft
Est. Value
About This Home
This home is located at 19544 Sky Oaks Way Unit 98, Los Gatos, CA 95030 and is currently estimated at $3,565,384, approximately $1,308 per square foot. 19544 Sky Oaks Way Unit 98 is a home located in Santa Clara County with nearby schools including Saratoga Elementary School, Foothill Elementary School, and Argonaut Elementary School.
Ownership History
Date
Name
Owned For
Owner Type
Purchase Details
Closed on
May 8, 2012
Sold by
Asher James J and Asher Virginia L
Bought by
Asher James J and Asher Virginia Lee
Current Estimated Value
Purchase Details
Closed on
May 15, 2003
Sold by
Asher James J and Asher Virginia Lee
Bought by
Asher James J and Asher Virginia Lee
Home Financials for this Owner
Home Financials are based on the most recent Mortgage that was taken out on this home.
Original Mortgage
$400,000
Interest Rate
5.61%
Mortgage Type
Purchase Money Mortgage
Purchase Details
Closed on
Oct 31, 1995
Sold by
Inglis Scott S
Bought by
Arriaga Louis C
Home Financials for this Owner
Home Financials are based on the most recent Mortgage that was taken out on this home.
Original Mortgage
$250,000
Interest Rate
7.58%
Mortgage Type
Purchase Money Mortgage
Create a Home Valuation Report for This Property
The Home Valuation Report is an in-depth analysis detailing your home's value as well as a comparison with similar homes in the area
Home Values in the Area
Average Home Value in this Area
Purchase History
| Date | Buyer | Sale Price | Title Company |
|---|---|---|---|
| Asher James J | -- | None Available | |
| Asher James J | -- | Fidelity National Title Ins | |
| Arriaga Louis C | -- | Commonwealth Land Title Ins |
Source: Public Records
Mortgage History
| Date | Status | Borrower | Loan Amount |
|---|---|---|---|
| Previous Owner | Asher James J | $400,000 | |
| Previous Owner | Arriaga Louis C | $250,000 |
Source: Public Records
Tax History Compared to Growth
Tax History
| Year | Tax Paid | Tax Assessment Tax Assessment Total Assessment is a certain percentage of the fair market value that is determined by local assessors to be the total taxable value of land and additions on the property. | Land | Improvement |
|---|---|---|---|---|
| 2025 | $3,210 | $262,395 | $90,762 | $171,633 |
| 2024 | $3,210 | $257,251 | $88,983 | $168,268 |
| 2023 | $3,109 | $252,208 | $87,239 | $164,969 |
| 2022 | $3,132 | $247,264 | $85,529 | $161,735 |
| 2021 | $3,084 | $242,416 | $83,852 | $158,564 |
| 2020 | $3,025 | $239,932 | $82,993 | $156,939 |
| 2019 | $2,984 | $235,228 | $81,366 | $153,862 |
| 2018 | $2,936 | $230,617 | $79,771 | $150,846 |
| 2017 | $2,926 | $226,096 | $78,207 | $147,889 |
| 2016 | $2,838 | $221,664 | $76,674 | $144,990 |
| 2015 | $2,788 | $218,336 | $75,523 | $142,813 |
| 2014 | $2,737 | $214,060 | $74,044 | $140,016 |
Source: Public Records
Map
Nearby Homes
- 19405 Bainter Ave
- 19394 Bainter Ave
- 19660 Bainter Way
- 15821 Hidden Hill Rd
- 19661 Saratoga Los Gatos Rd
- 15050 Oriole Rd
- 19233 Mountain Way
- 14835 Farwell Ave
- 16070 Matilija Dr
- 19305 Zinfandel Ct
- 15253 Montalvo Rd
- 15390 Quito Rd
- 20141 Mendelsohn Ln
- 14582 Horseshoe Dr
- 11750 Redwood Trail Unit 61-13 Plan 4
- 11710 Redwood Trail Unit 57-13 Plan 3
- 14685 Horseshoe Dr
- 15292 Stratford Ct
- 18561 Arbolado Way
- 19825 Douglass Ln
- 19574 Sky Oaks Way
- 19480 Bainter Ave
- 19544 Glen Una Dr
- 19574 Glen Una Dr
- 19520 Bainter Ave
- 19600 Sky Oaks Way
- 19536 Bainter Ave
- 19518 Glen Una Dr
- 19525 Glen Una Dr
- 19604 Glen Una Dr
- 19550 Bainter Ave
- 19510 Glen Una Dr
- 19460 Bainter Ave
- 19611 Sky Oaks Way
- 19630 Sky Oaks Way
- 19565 Glen Una Dr
- 19605 Glen Una Dr
- 19632 Glen Una Dr
- 19519 Glen Una Dr
- 19508 Glen Una Dr