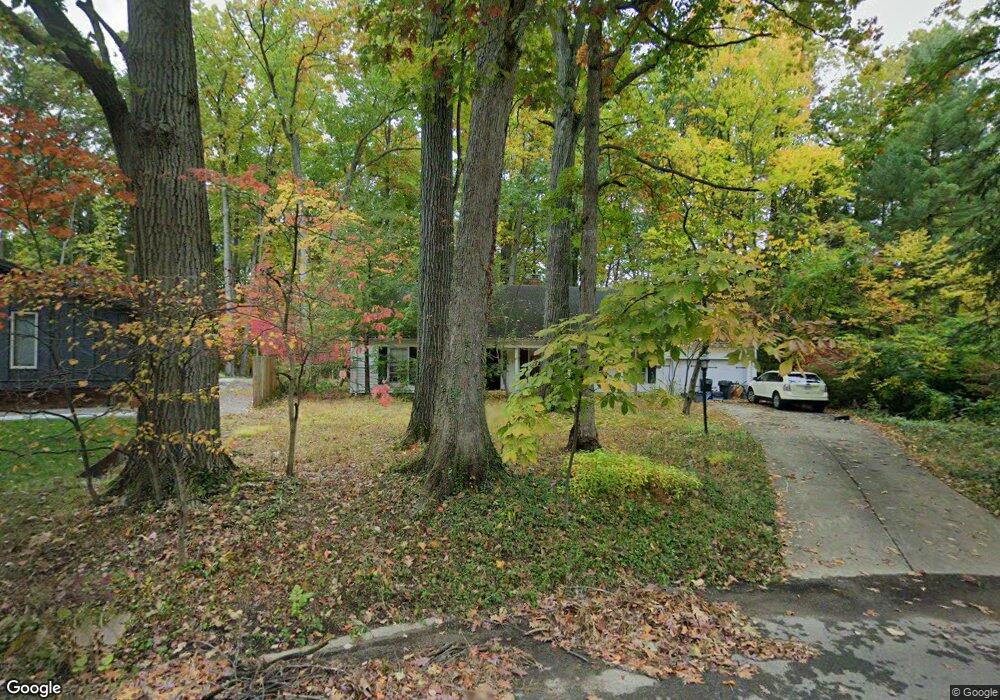
19546 Tanbark Ln Strongsville, OH 44149
Estimated Value: $372,612 - $466,000
4
Beds
3
Baths
2,665
Sq Ft
$153/Sq Ft
Est. Value
About This Home
This home is located at 19546 Tanbark Ln, Strongsville, OH 44149 and is currently estimated at $407,403, approximately $152 per square foot. 19546 Tanbark Ln is a home located in Cuyahoga County with nearby schools including Strongsville High School and Sts Joseph & John Interparochial School.
Ownership History
Date
Name
Owned For
Owner Type
Purchase Details
Closed on
May 11, 2006
Sold by
Frizzelle Roberta A
Bought by
Sikora Patricia A
Current Estimated Value
Home Financials for this Owner
Home Financials are based on the most recent Mortgage that was taken out on this home.
Original Mortgage
$20,000
Outstanding Balance
$1,170
Interest Rate
6.56%
Mortgage Type
Credit Line Revolving
Estimated Equity
$406,233
Purchase Details
Closed on
May 21, 1993
Sold by
Frizzelle Roberta A
Bought by
Frizzelle Roberta A
Purchase Details
Closed on
Nov 18, 1983
Sold by
Dorsey Sean W
Bought by
Frizzelle Roberta A
Purchase Details
Closed on
Mar 3, 1983
Sold by
Halvorsen Gunnor B and Halvorsen Barbara H
Bought by
Gross Roberta A
Purchase Details
Closed on
Jan 1, 1975
Bought by
Halvorsen Gunnor B and Halvorsen Barbara H
Create a Home Valuation Report for This Property
The Home Valuation Report is an in-depth analysis detailing your home's value as well as a comparison with similar homes in the area
Home Values in the Area
Average Home Value in this Area
Purchase History
| Date | Buyer | Sale Price | Title Company |
|---|---|---|---|
| Sikora Patricia A | $178,000 | Anthem | |
| Frizzelle Roberta A | -- | -- | |
| Frizzelle Roberta A | $65,000 | -- | |
| Dorsey Sean W | -- | -- | |
| Gross Roberta A | $130,000 | -- | |
| Halvorsen Gunnor B | -- | -- |
Source: Public Records
Mortgage History
| Date | Status | Borrower | Loan Amount |
|---|---|---|---|
| Open | Sikora Patricia A | $20,000 | |
| Open | Sikora Patricia A | $104,600 |
Source: Public Records
Tax History Compared to Growth
Tax History
| Year | Tax Paid | Tax Assessment Tax Assessment Total Assessment is a certain percentage of the fair market value that is determined by local assessors to be the total taxable value of land and additions on the property. | Land | Improvement |
|---|---|---|---|---|
| 2024 | $5,323 | $113,365 | $20,545 | $92,820 |
| 2023 | $5,144 | $82,150 | $17,470 | $64,680 |
| 2022 | $5,106 | $82,150 | $17,470 | $64,680 |
| 2021 | $5,066 | $82,150 | $17,470 | $64,680 |
| 2020 | $5,024 | $72,070 | $15,330 | $56,740 |
| 2019 | $4,877 | $205,900 | $43,800 | $162,100 |
| 2018 | $4,426 | $72,070 | $15,330 | $56,740 |
| 2017 | $4,770 | $71,900 | $12,500 | $59,400 |
| 2016 | $4,731 | $71,900 | $12,500 | $59,400 |
| 2015 | $4,658 | $71,900 | $12,500 | $59,400 |
| 2014 | $4,658 | $69,800 | $12,150 | $57,650 |
Source: Public Records
Map
Nearby Homes
- 10986 Fawn Meadow Ln
- 19890 Idlewood Trail
- 11179 Fawn Meadow Ln
- 19240 Briarwood Ln
- 19997 Idlewood Trail
- 20050 Idlewood Trail
- 11432 Pearl Rd
- 20424 Scotch Pine Way
- 11499 Pearl Rd Unit A106
- 9401 Pheasant Run Place
- 20684 Albion Rd
- 18433 Whitney Rd
- 10839 Prospect Rd
- 12385 Corinth Ct
- 12539 Olympus Way
- 11650 River Moss Rd
- 18336 Falling Water Rd
- 21176 Hickory Branch Trail
- 12647 Edgepark Cir
- 12694 Ionia Ct
- 19518 Tanbark Ln
- 19550 Tanbark Ln
- 19547 Tanbark Ln
- 19586 Tanbark Ln
- 19551 Tanbark Ln
- 19583 Tanbark Ln
- 19618 Tanbark Ln
- 19615 Tanbark Ln
- 10432 Jerry Coe Ln
- 10547 Hickory Place
- 10484 Jerry Coe Ln
- 10570 Jerry Coe Ln
- 10346 Jerry Coe Ln
- 19655 Tanbark Ln
- 19686 Tanbark Ln
- 10616 Jerry Coe Ln
- 19655 Tanback Ln
- 19691 Tanbark Ln
- 10664 Jerry Coe Ln
- 10532 Hickory Place