Estimated Value: $314,000 - $383,000
--
Bed
2
Baths
858
Sq Ft
$398/Sq Ft
Est. Value
About This Home
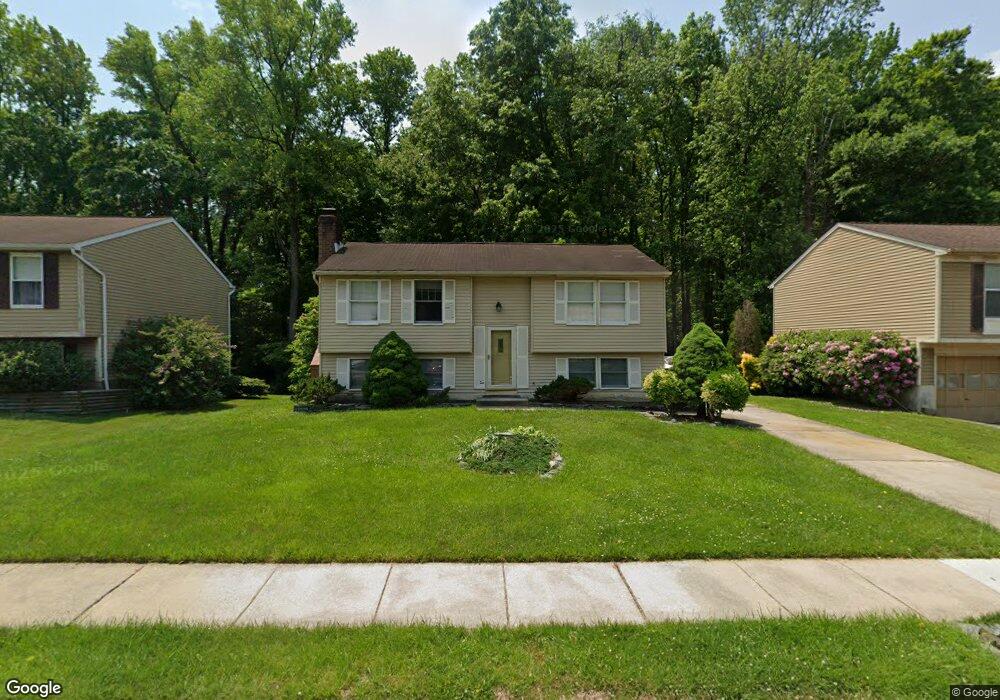
This home is located at 1959 Sue Creek Dr, Essex, MD 21221 and is currently estimated at $341,454, approximately $397 per square foot. 1959 Sue Creek Dr is a home located in Baltimore County with nearby schools including Middleborough Elementary School, Deep Creek Middle, and Chesapeake High School.
Ownership History
Date
Name
Owned For
Owner Type
Purchase Details
Closed on
Jan 20, 2006
Sold by
Zalenski Mark A
Bought by
Stanley John O
Current Estimated Value
Home Financials for this Owner
Home Financials are based on the most recent Mortgage that was taken out on this home.
Original Mortgage
$47,000
Interest Rate
6.28%
Mortgage Type
Stand Alone Second
Purchase Details
Closed on
Dec 21, 2005
Sold by
Zalenski Mark A
Bought by
Stanley John O
Home Financials for this Owner
Home Financials are based on the most recent Mortgage that was taken out on this home.
Original Mortgage
$47,000
Interest Rate
6.28%
Mortgage Type
Stand Alone Second
Purchase Details
Closed on
Dec 27, 2002
Sold by
Sharpless David S
Bought by
Zalenski Mark A
Purchase Details
Closed on
Mar 13, 1991
Sold by
Sharpless David S 3Rd
Bought by
Sharpless David S 3Rd
Create a Home Valuation Report for This Property
The Home Valuation Report is an in-depth analysis detailing your home's value as well as a comparison with similar homes in the area
Home Values in the Area
Average Home Value in this Area
Purchase History
| Date | Buyer | Sale Price | Title Company |
|---|---|---|---|
| Stanley John O | $235,000 | -- | |
| Stanley John O | $235,000 | -- | |
| Stanley John O | $235,000 | -- | |
| Stanley John O | $235,000 | -- | |
| Zalenski Mark A | $163,700 | -- | |
| Sharpless David S 3Rd | -- | -- |
Source: Public Records
Mortgage History
| Date | Status | Borrower | Loan Amount |
|---|---|---|---|
| Closed | Stanley John O | $47,000 | |
| Open | Stanley John O | $188,000 | |
| Closed | Stanley John O | $188,000 |
Source: Public Records
Tax History Compared to Growth
Tax History
| Year | Tax Paid | Tax Assessment Tax Assessment Total Assessment is a certain percentage of the fair market value that is determined by local assessors to be the total taxable value of land and additions on the property. | Land | Improvement |
|---|---|---|---|---|
| 2025 | $3,198 | $254,967 | -- | -- |
| 2024 | $3,198 | $237,833 | $0 | $0 |
| 2023 | $1,533 | $220,700 | $90,600 | $130,100 |
| 2022 | $3,159 | $205,300 | $0 | $0 |
| 2021 | $3,191 | $189,900 | $0 | $0 |
| 2020 | $3,191 | $174,500 | $90,600 | $83,900 |
| 2019 | $2,991 | $174,500 | $90,600 | $83,900 |
| 2018 | $2,891 | $174,500 | $90,600 | $83,900 |
| 2017 | $2,791 | $176,100 | $0 | $0 |
| 2016 | $3,256 | $174,600 | $0 | $0 |
| 2015 | $3,256 | $173,100 | $0 | $0 |
| 2014 | $3,256 | $171,600 | $0 | $0 |
Source: Public Records
Map
Nearby Homes
- 1920 Sue Ave
- 312 Long Cove Ln
- 2028 William Ave
- 502 Brighton Place
- 2034 William Ave
- 2036 William Ave
- 516 Brighton Place
- 1936 Newhaven Dr
- 2042 Hackberry Rd
- 0 Sue Grove Rd Unit MDBC2111384
- 3 Lacebark Ct
- 863 Sue Grove Rd
- 311 Greyhound Rd
- 2327 Turkey Point Rd
- Parcel on Park Dr
- 1937 Cape May Rd
- 2316 Bauernschmidt Dr
- 1634 Cape May Rd
- 2400 Holly Neck Rd
- 14 Norman Creek Ct
- 1957 Sue Creek Dr
- 1961 Sue Creek Dr
- 1963 Sue Creek Dr
- 1955 Sue Creek Dr
- 1954 Sue Creek Dr
- 1958 Sue Creek Dr
- 1965 Sue Creek Dr
- 1952 Sue Creek Dr
- 1953 Sue Creek Dr
- 1950 Sue Creek Dr
- 1960 Sue Creek Dr
- 1967 Sue Creek Dr
- 1951 Sue Creek Dr
- 1951 Sue Ave
- 1948 Sue Creek Dr
- 1969 Sue Creek Dr
- 1949 Sue Creek Dr
- 1949 Sue Ave
- 2037 Sue Ave
- 1946 Sue Creek Dr