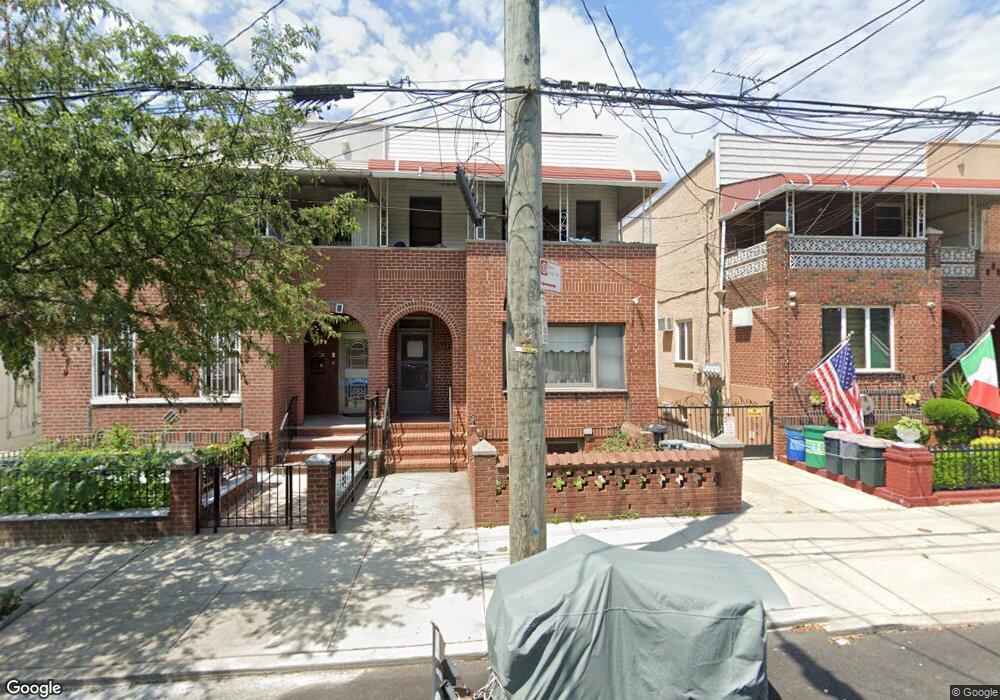
1964 W 12th St Brooklyn, NY 11223
Gravesend NeighborhoodEstimated Value: $1,166,565 - $1,683,000
--
Bed
--
Bath
2,092
Sq Ft
$665/Sq Ft
Est. Value
About This Home
This home is located at 1964 W 12th St, Brooklyn, NY 11223 and is currently estimated at $1,391,141, approximately $664 per square foot. 1964 W 12th St is a home located in Kings County with nearby schools including P.S. 97 - The Highlawn, Is 228 David A Boody, and Hebrew Language Academy Charter 2.
Ownership History
Date
Name
Owned For
Owner Type
Purchase Details
Closed on
Dec 7, 2016
Sold by
Mule John and Mule Philip
Bought by
Feng Qinghui and Ting Chung Wai
Current Estimated Value
Purchase Details
Closed on
Feb 5, 2016
Sold by
Rendini Frank
Bought by
Rendini Edward J
Purchase Details
Closed on
Nov 20, 2002
Sold by
Mule As Sole Surviving Tenant Frances
Bought by
Mule John and Mule Philip
Purchase Details
Closed on
Aug 5, 1997
Sold by
Mondello Anthony
Bought by
Huang Chao Chang and Huang Yan Qing
Create a Home Valuation Report for This Property
The Home Valuation Report is an in-depth analysis detailing your home's value as well as a comparison with similar homes in the area
Home Values in the Area
Average Home Value in this Area
Purchase History
| Date | Buyer | Sale Price | Title Company |
|---|---|---|---|
| Feng Qinghui | $1,185,000 | -- | |
| Feng Qinghui | $1,185,000 | -- | |
| Rendini Edward J | -- | -- | |
| Rendini Edward J | -- | -- | |
| Mule John | -- | -- | |
| Mule John | -- | -- | |
| Huang Chao Chang | $255,000 | -- | |
| Huang Chao Chang | $255,000 | -- |
Source: Public Records
Tax History Compared to Growth
Tax History
| Year | Tax Paid | Tax Assessment Tax Assessment Total Assessment is a certain percentage of the fair market value that is determined by local assessors to be the total taxable value of land and additions on the property. | Land | Improvement |
|---|---|---|---|---|
| 2025 | $8,636 | $75,300 | $14,400 | $60,900 |
| 2024 | $8,636 | $68,700 | $14,400 | $54,300 |
| 2023 | $8,295 | $84,300 | $14,400 | $69,900 |
| 2022 | $7,725 | $75,720 | $14,400 | $61,320 |
| 2021 | $7,691 | $68,460 | $14,400 | $54,060 |
| 2020 | $3,823 | $66,000 | $14,400 | $51,600 |
| 2019 | $7,495 | $66,000 | $14,400 | $51,600 |
| 2018 | $6,939 | $34,038 | $10,749 | $23,289 |
| 2017 | $6,573 | $32,246 | $8,215 | $24,031 |
| 2016 | $6,088 | $30,456 | $7,614 | $22,842 |
| 2015 | $3,030 | $30,456 | $10,127 | $20,329 |
| 2014 | $3,030 | $29,859 | $10,313 | $19,546 |
Source: Public Records
Map
Nearby Homes