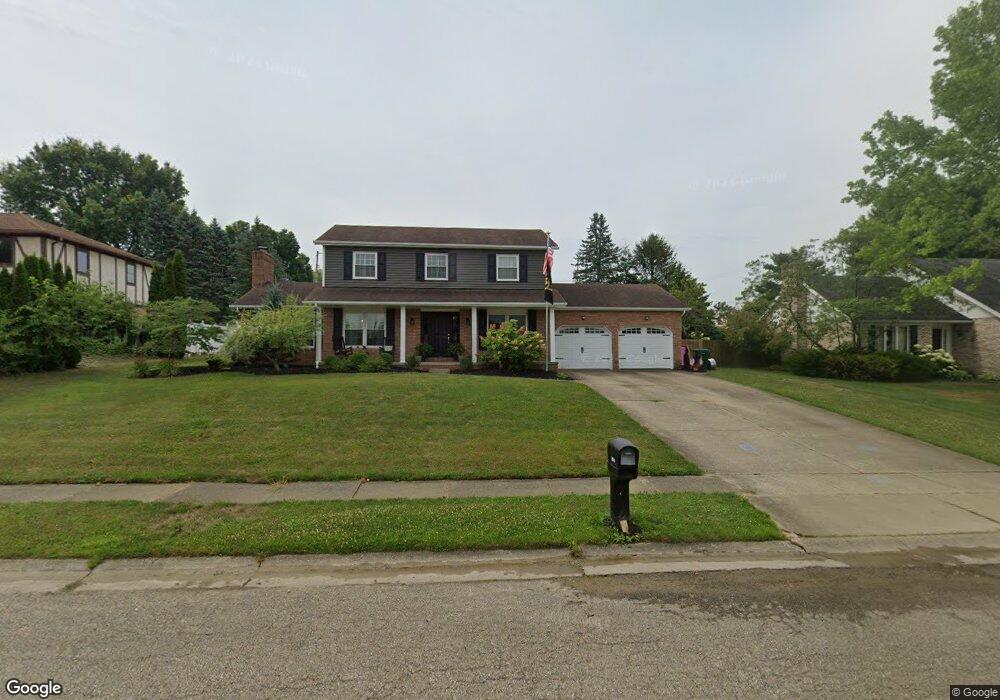
1966 Opal St Louisville, OH 44641
Estimated Value: $255,000 - $312,000
3
Beds
3
Baths
2,100
Sq Ft
$136/Sq Ft
Est. Value
About This Home
This home is located at 1966 Opal St, Louisville, OH 44641 and is currently estimated at $286,266, approximately $136 per square foot. 1966 Opal St is a home located in Stark County with nearby schools including Louisville High School and St. Thomas Aquinas High School & Middle School.
Ownership History
Date
Name
Owned For
Owner Type
Purchase Details
Closed on
May 6, 2004
Sold by
Amrhein Gerald T and Amrhein Christine B
Bought by
Rebuck Denise M and Rebuck Shawn D
Current Estimated Value
Home Financials for this Owner
Home Financials are based on the most recent Mortgage that was taken out on this home.
Original Mortgage
$152,112
Outstanding Balance
$71,971
Interest Rate
5.63%
Mortgage Type
FHA
Estimated Equity
$214,295
Purchase Details
Closed on
Jan 5, 1990
Create a Home Valuation Report for This Property
The Home Valuation Report is an in-depth analysis detailing your home's value as well as a comparison with similar homes in the area
Home Values in the Area
Average Home Value in this Area
Purchase History
| Date | Buyer | Sale Price | Title Company |
|---|---|---|---|
| Rebuck Denise M | $154,500 | -- | |
| -- | $88,000 | -- |
Source: Public Records
Mortgage History
| Date | Status | Borrower | Loan Amount |
|---|---|---|---|
| Open | Rebuck Denise M | $152,112 |
Source: Public Records
Tax History Compared to Growth
Tax History
| Year | Tax Paid | Tax Assessment Tax Assessment Total Assessment is a certain percentage of the fair market value that is determined by local assessors to be the total taxable value of land and additions on the property. | Land | Improvement |
|---|---|---|---|---|
| 2025 | -- | $77,910 | $17,640 | $60,270 |
| 2024 | -- | $77,910 | $17,640 | $60,270 |
| 2023 | $2,693 | $62,660 | $16,630 | $46,030 |
| 2022 | $2,699 | $62,660 | $16,630 | $46,030 |
| 2021 | $2,706 | $62,660 | $16,630 | $46,030 |
| 2020 | $2,332 | $58,660 | $14,980 | $43,680 |
| 2019 | $2,204 | $55,200 | $14,530 | $40,670 |
| 2018 | $2,196 | $55,200 | $14,530 | $40,670 |
| 2017 | $2,031 | $49,250 | $12,740 | $36,510 |
| 2016 | $2,072 | $49,250 | $12,740 | $36,510 |
| 2015 | $2,078 | $49,250 | $12,740 | $36,510 |
| 2014 | $1,934 | $42,600 | $11,030 | $31,570 |
| 2013 | $971 | $42,600 | $11,030 | $31,570 |
Source: Public Records
Map
Nearby Homes
- 2110 Edmar St
- 1812 E Broad St
- 1715 High St
- 3390 Meese Rd NE
- 641 S Nickelplate St
- 2015 E Main St
- 308 Superior St
- 520 S Silver St
- 908 Sand Lot Cir
- 0 Michigan Blvd
- 728 E Broad St
- 8225 Georgetown St
- 510 S Bauman Ct
- 204 E Broad St
- 107 E Broad St
- 325 Lincoln Ave
- 1702 View Pointe Ave
- 1170 Winding Ridge Ave
- 1639 Horizon Dr
- 910 Crosswyck Cir