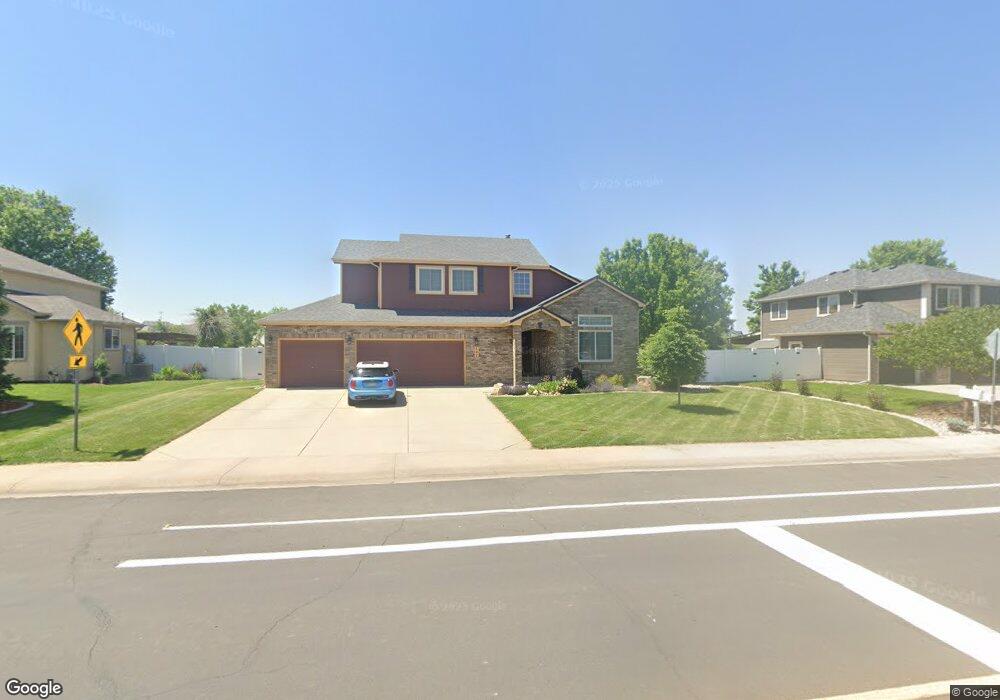
197 63rd Ave Greeley, CO 80634
Estimated Value: $521,207 - $572,000
4
Beds
3
Baths
2,000
Sq Ft
$275/Sq Ft
Est. Value
About This Home
This home is located at 197 63rd Ave, Greeley, CO 80634 and is currently estimated at $550,552, approximately $275 per square foot. 197 63rd Ave is a home located in Weld County with nearby schools including Winograd K-8 Elementary School, Northridge High School, and West Ridge Academy Charter.
Ownership History
Date
Name
Owned For
Owner Type
Purchase Details
Closed on
Sep 26, 2003
Sold by
Bizien Marcel D and Bizien Carolyn J
Bought by
Seivley John R and Seivley Vickie Lynn
Current Estimated Value
Home Financials for this Owner
Home Financials are based on the most recent Mortgage that was taken out on this home.
Original Mortgage
$207,200
Outstanding Balance
$79,314
Interest Rate
3.62%
Mortgage Type
Unknown
Estimated Equity
$471,238
Purchase Details
Closed on
Aug 24, 2001
Sold by
Sunflower Building Corp
Bought by
Bizien Marcel D and Bizien Carolyn J
Home Financials for this Owner
Home Financials are based on the most recent Mortgage that was taken out on this home.
Original Mortgage
$206,815
Interest Rate
7.07%
Purchase Details
Closed on
Jan 28, 1994
Bought by
Shupe Harvey D
Create a Home Valuation Report for This Property
The Home Valuation Report is an in-depth analysis detailing your home's value as well as a comparison with similar homes in the area
Home Values in the Area
Average Home Value in this Area
Purchase History
| Date | Buyer | Sale Price | Title Company |
|---|---|---|---|
| Seivley John R | $259,000 | Stewart Title | |
| Bizien Marcel D | $217,700 | Stewart Title | |
| Shupe Harvey D | -- | -- |
Source: Public Records
Mortgage History
| Date | Status | Borrower | Loan Amount |
|---|---|---|---|
| Open | Seivley John R | $207,200 | |
| Previous Owner | Bizien Marcel D | $206,815 |
Source: Public Records
Tax History Compared to Growth
Tax History
| Year | Tax Paid | Tax Assessment Tax Assessment Total Assessment is a certain percentage of the fair market value that is determined by local assessors to be the total taxable value of land and additions on the property. | Land | Improvement |
|---|---|---|---|---|
| 2025 | $2,470 | $30,320 | $7,190 | $23,130 |
| 2024 | $2,470 | $30,320 | $7,190 | $23,130 |
| 2023 | $2,356 | $32,980 | $5,340 | $27,640 |
| 2022 | $2,347 | $26,790 | $4,870 | $21,920 |
| 2021 | $2,421 | $27,560 | $5,010 | $22,550 |
| 2020 | $2,270 | $25,920 | $3,580 | $22,340 |
| 2019 | $2,276 | $25,920 | $3,580 | $22,340 |
| 2018 | $1,803 | $21,660 | $2,880 | $18,780 |
| 2017 | $1,813 | $21,660 | $2,880 | $18,780 |
| 2016 | $1,550 | $20,830 | $2,790 | $18,040 |
| 2015 | $1,544 | $20,830 | $2,790 | $18,040 |
| 2014 | $1,313 | $17,290 | $2,790 | $14,500 |
Source: Public Records
Map
Nearby Homes
- 6302 2nd St
- 118 65th Ave
- 6614 2nd St
- 106 65th Ave
- 102 65th Ave
- BRIDGEPORT Plan at Northridge Estates
- 6618 2nd St
- HENNESSY Plan at Northridge Estates
- HENLEY Plan at Northridge Estates
- 6315 W 5th St
- 215 N 62nd Ave
- 117 N 66th Ave
- 317 N 64th Ave
- 6608 W 3rd St Unit 69
- 6608 W 3rd St Unit 35-58
- 6147 B St
- 6603 W 3rd St Unit 1620
- 5726 W 3rd St
- 5722 W 3rd St
- 5700 W 2nd Street Rd