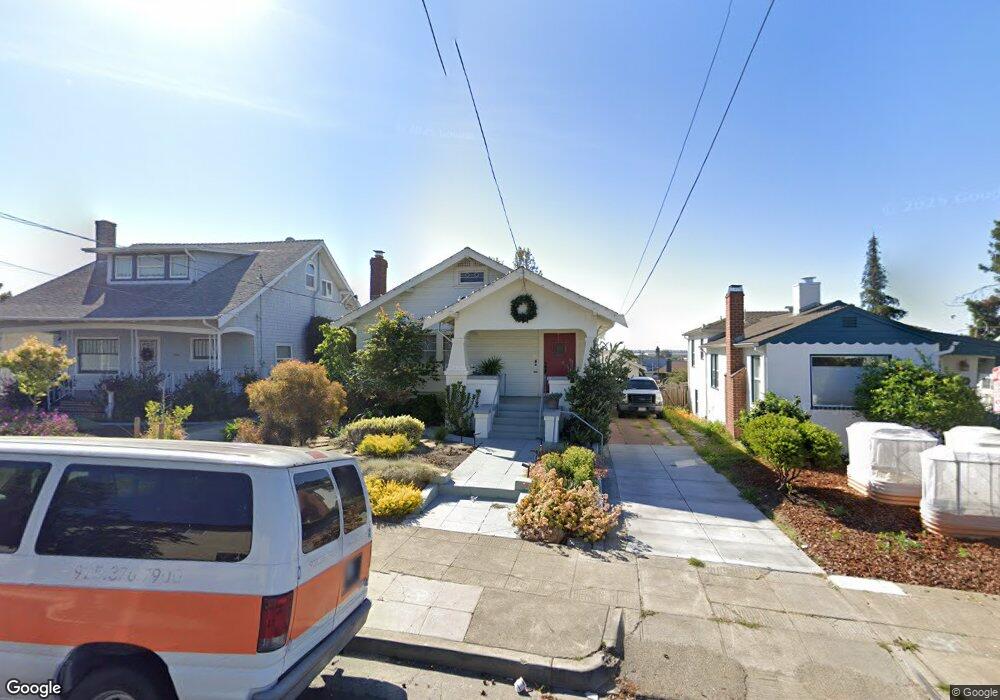
1970 42nd Ave Oakland, CA 94601
Jefferson NeighborhoodEstimated Value: $536,000 - $759,000
3
Beds
1
Bath
1,350
Sq Ft
$456/Sq Ft
Est. Value
About This Home
This home is located at 1970 42nd Ave, Oakland, CA 94601 and is currently estimated at $615,878, approximately $456 per square foot. 1970 42nd Ave is a home located in Alameda County with nearby schools including Global Family, Urban Promise Academy, and United For Success Academy.
Ownership History
Date
Name
Owned For
Owner Type
Purchase Details
Closed on
Sep 29, 2020
Sold by
Navarro Lasley Lorraine Claire and Navarro Lorraine Claire
Bought by
Lasley Lorraine Claire Navar
Current Estimated Value
Home Financials for this Owner
Home Financials are based on the most recent Mortgage that was taken out on this home.
Original Mortgage
$343,000
Outstanding Balance
$305,080
Interest Rate
2.9%
Mortgage Type
New Conventional
Estimated Equity
$310,798
Purchase Details
Closed on
Mar 14, 2006
Sold by
Navarro Lorraine Claire and Navarro Lorraine C
Bought by
Navarro Lorraine Claire
Home Financials for this Owner
Home Financials are based on the most recent Mortgage that was taken out on this home.
Original Mortgage
$319,500
Interest Rate
6.25%
Mortgage Type
New Conventional
Purchase Details
Closed on
Jan 3, 2003
Sold by
Navarro Priciliano
Bought by
Navarro Lorraine C
Create a Home Valuation Report for This Property
The Home Valuation Report is an in-depth analysis detailing your home's value as well as a comparison with similar homes in the area
Home Values in the Area
Average Home Value in this Area
Purchase History
| Date | Buyer | Sale Price | Title Company |
|---|---|---|---|
| Lasley Lorraine Claire Navar | -- | Chicago Title | |
| Lasley Lorraine Claire Navar | -- | Chicago Title | |
| Navarro Lorraine Claire | -- | Lawyers Title Company | |
| Navarro Lorraine C | -- | Commonwealth Land Title Co |
Source: Public Records
Mortgage History
| Date | Status | Borrower | Loan Amount |
|---|---|---|---|
| Open | Lasley Lorraine Claire Navar | $343,000 | |
| Closed | Lasley Lorraine Claire Navar | $343,000 | |
| Previous Owner | Navarro Lorraine Claire | $319,500 |
Source: Public Records
Tax History Compared to Growth
Tax History
| Year | Tax Paid | Tax Assessment Tax Assessment Total Assessment is a certain percentage of the fair market value that is determined by local assessors to be the total taxable value of land and additions on the property. | Land | Improvement |
|---|---|---|---|---|
| 2025 | $4,326 | $193,972 | $121,732 | $79,240 |
| 2024 | $4,326 | $190,032 | $119,345 | $77,687 |
| 2023 | $4,429 | $193,168 | $117,005 | $76,163 |
| 2022 | $4,249 | $182,381 | $114,711 | $74,670 |
| 2021 | $3,939 | $178,668 | $112,462 | $73,206 |
| 2020 | $3,891 | $183,765 | $111,309 | $72,456 |
| 2019 | $3,666 | $180,162 | $109,127 | $71,035 |
| 2018 | $3,588 | $176,630 | $106,987 | $69,643 |
| 2017 | $3,421 | $173,167 | $104,890 | $68,277 |
| 2016 | $3,232 | $169,773 | $102,834 | $66,939 |
| 2015 | $3,689 | $167,223 | $101,289 | $65,934 |
| 2014 | $3,600 | $163,948 | $99,306 | $64,642 |
Source: Public Records
Map
Nearby Homes
- 1211 41st Ave
- 1205 41st Ave
- 2123 High St
- 1718 High St
- 2042 Rosedale Ave
- 1818 Rosedale Ave
- 4114 E 17th St
- 2158 High St
- 4010 Foothill Blvd
- 2162 45th Ave
- 1631 Rosedale Ave
- 4510 San Carlos Ave
- 4709 Foothill Blvd
- 4037 E 16th St
- 2105 48th Ave
- 1620 46th Ave
- 1430 45th Ave
- 2290 High St
- 1507 48th Ave
- 2309 High St
- 1964 42nd Ave
- 1976 42nd Ave
- 2005 High St
- 1984 42nd Ave
- 1958 42nd Ave
- 1961 Courtland Ave
- 2000 42nd Ave
- 1967 Courtland Ave
- 1952 42nd Ave
- 1955 Courtland Ave
- 4149 Mera St
- 1975 Courtland Ave
- 2008 42nd Ave
- 1945 Courtland Ave
- 1948 42nd Ave
- 2007 High St
- 1931 Courtland Ave
- 2011 High St
- 4143 Mera St
- 2019 High St