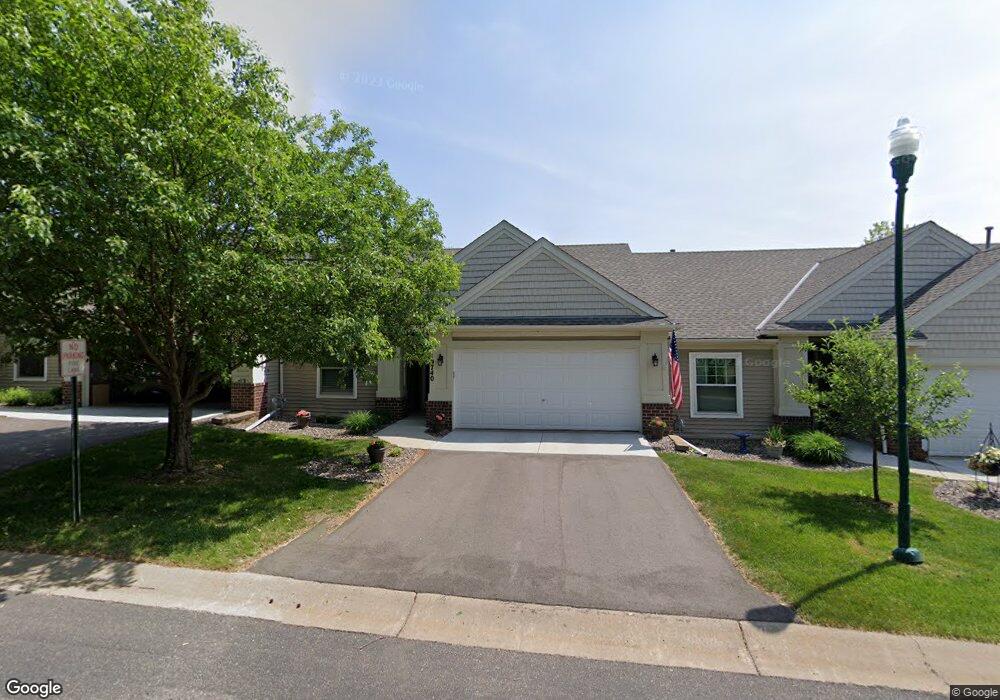
19740 Goldfinch Dr Unit 66 Farmington, MN 55024
Estimated Value: $280,000 - $364,000
3
Beds
3
Baths
2,408
Sq Ft
$140/Sq Ft
Est. Value
About This Home
This home is located at 19740 Goldfinch Dr Unit 66, Farmington, MN 55024 and is currently estimated at $336,871, approximately $139 per square foot. 19740 Goldfinch Dr Unit 66 is a home located in Dakota County with nearby schools including Riverview Elementary School, Levi P. Dodge Middle School, and Farmington High School.
Ownership History
Date
Name
Owned For
Owner Type
Purchase Details
Closed on
Jun 8, 2020
Sold by
Coakley Thomas and Coakley Carol
Bought by
Higgins Patricia
Current Estimated Value
Purchase Details
Closed on
Aug 13, 2019
Sold by
Alexander Adam and Alexander Evelyn
Bought by
Coakley Thomas and Coakley Carol
Home Financials for this Owner
Home Financials are based on the most recent Mortgage that was taken out on this home.
Original Mortgage
$236,000
Interest Rate
3.7%
Mortgage Type
New Conventional
Purchase Details
Closed on
Oct 14, 2016
Sold by
Basic Builders Inc
Bought by
Riches Beverly
Home Financials for this Owner
Home Financials are based on the most recent Mortgage that was taken out on this home.
Original Mortgage
$266,467
Interest Rate
3.46%
Mortgage Type
Future Advance Clause Open End Mortgage
Purchase Details
Closed on
Oct 24, 2003
Sold by
The Rottlund Co Inc
Bought by
Riches Beverly C
Create a Home Valuation Report for This Property
The Home Valuation Report is an in-depth analysis detailing your home's value as well as a comparison with similar homes in the area
Home Values in the Area
Average Home Value in this Area
Purchase History
| Date | Buyer | Sale Price | Title Company |
|---|---|---|---|
| Higgins Patricia | $289,900 | Title One Inc | |
| Coakley Thomas | $295,000 | Burnet Title | |
| Riches Beverly | $261,351 | Dca Title | |
| Riches Beverly C | $217,800 | -- |
Source: Public Records
Mortgage History
| Date | Status | Borrower | Loan Amount |
|---|---|---|---|
| Previous Owner | Coakley Thomas | $236,000 | |
| Previous Owner | Riches Beverly | $266,467 |
Source: Public Records
Tax History Compared to Growth
Tax History
| Year | Tax Paid | Tax Assessment Tax Assessment Total Assessment is a certain percentage of the fair market value that is determined by local assessors to be the total taxable value of land and additions on the property. | Land | Improvement |
|---|---|---|---|---|
| 2024 | $4,392 | $360,800 | $62,900 | $297,900 |
| 2023 | $4,392 | $364,400 | $61,200 | $303,200 |
| 2022 | $4,086 | $357,300 | $61,000 | $296,300 |
| 2021 | $3,868 | $295,500 | $42,800 | $252,700 |
| 2020 | $3,660 | $279,300 | $40,800 | $238,500 |
| 2019 | $3,376 | $256,500 | $38,800 | $217,700 |
| 2018 | $3,107 | $234,600 | $36,000 | $198,600 |
| 2017 | $2,984 | $212,300 | $33,300 | $179,000 |
| 2016 | $2,849 | $199,900 | $31,700 | $168,200 |
| 2015 | $2,462 | $167,026 | $26,917 | $140,109 |
| 2014 | -- | $152,529 | $24,180 | $128,349 |
| 2013 | -- | $150,131 | $21,397 | $128,734 |
Source: Public Records
Map
Nearby Homes
- 19772 Goldfinch Dr Unit 71
- 19741 Falcon Path
- 19622 Escalade Way Unit 1007
- 19896 Escalade Way
- 19600 Estes Path
- 5690 200th St W Unit 202
- 19714 Executive Path
- 19353 Eureka Ct
- 5921 200th St W
- 19927 Akin Rd
- 5215 203rd St W
- 19298 Evening Star Way
- 20050 Dunbar Ave
- 19320 Ellington Trail
- 20514 Erin Ct Unit 15
- 5151 193rd St W
- 19265 Everfield Ave
- 20170 Dunbar Ave
- 19229 Everfield Ave
- 19432 Everfield Ave
- 19732 Goldfinch Dr Unit 65
- 19748 Goldfinch Dr Unit 67
- 19756 Goldfinch Dr
- 19724 Goldfinch Dr Unit 64
- 19764 Goldfinch Dr Unit 69
- 19716 Goldfinch Dr Unit 63
- 19708 Goldfinch Dr Unit 62
- 19768 Goldfinch Dr Unit 70
- 19700 Goldfinch Dr Unit 61
- 19772 Goldfinch Dr
- 18133 Goldfinch Dr
- 19776 Goldfinch Dr Unit 72
- 19735 Canary Path Unit 95
- 19731 Canary Path
- 19725 Canary Path
- 19721 Canary Path Unit 98
- 18155 Goldfinch Dr
- 19715 Canary Path Unit 99
- 19743 Canary Path Unit 94
- 19751 Canary Path Unit 92