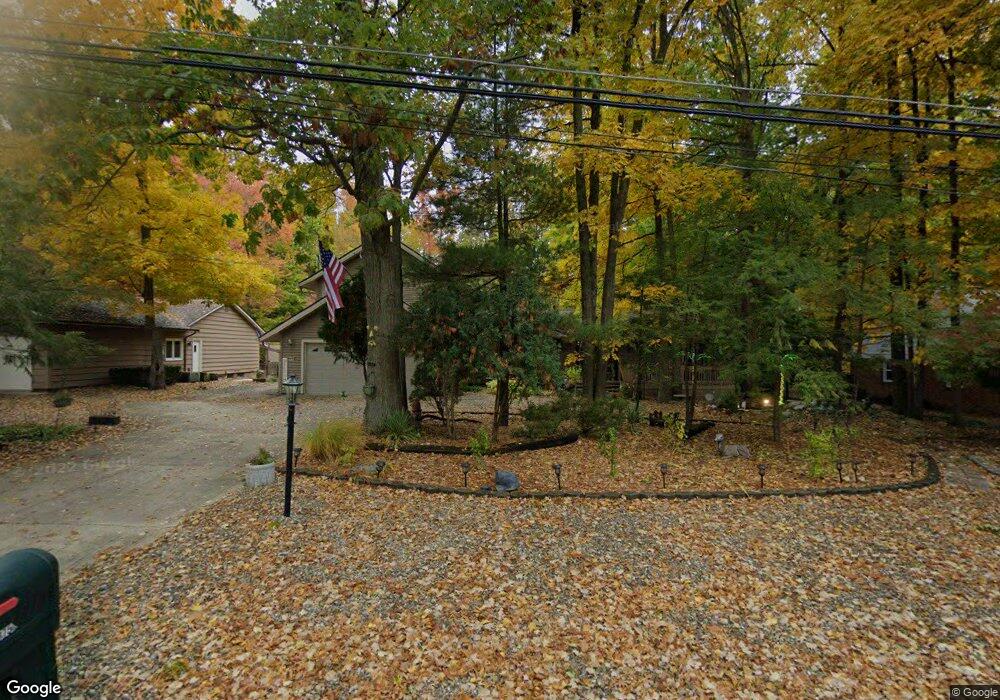
19754 Tanbark Ln Strongsville, OH 44149
Estimated Value: $417,247 - $454,000
3
Beds
3
Baths
3,046
Sq Ft
$144/Sq Ft
Est. Value
About This Home
This home is located at 19754 Tanbark Ln, Strongsville, OH 44149 and is currently estimated at $437,312, approximately $143 per square foot. 19754 Tanbark Ln is a home located in Cuyahoga County with nearby schools including Strongsville High School and Sts Joseph & John Interparochial School.
Ownership History
Date
Name
Owned For
Owner Type
Purchase Details
Closed on
Jul 31, 1997
Sold by
Gorman John J
Bought by
Olszewski Andrew and Olszewski Nancy C
Current Estimated Value
Home Financials for this Owner
Home Financials are based on the most recent Mortgage that was taken out on this home.
Original Mortgage
$121,000
Outstanding Balance
$18,408
Interest Rate
7.71%
Mortgage Type
New Conventional
Estimated Equity
$418,904
Purchase Details
Closed on
Jan 6, 1992
Sold by
Long William E and Long Susan W
Bought by
Gorman John
Purchase Details
Closed on
Jul 28, 1983
Sold by
Money Anthony
Bought by
Long William E and Long Susan W
Purchase Details
Closed on
Apr 30, 1976
Sold by
Long Susan W
Bought by
Money Anthony
Purchase Details
Closed on
Oct 20, 1975
Sold by
Long Wm E and Long Susan W
Bought by
Long Susan W
Purchase Details
Closed on
Jan 1, 1975
Bought by
Long Wm E and Long Susan W
Create a Home Valuation Report for This Property
The Home Valuation Report is an in-depth analysis detailing your home's value as well as a comparison with similar homes in the area
Home Values in the Area
Average Home Value in this Area
Purchase History
| Date | Buyer | Sale Price | Title Company |
|---|---|---|---|
| Olszewski Andrew | $192,000 | -- | |
| Gorman John | -- | -- | |
| Long William E | $105,000 | -- | |
| Money Anthony | $91,000 | -- | |
| Long Susan W | -- | -- | |
| Long Wm E | -- | -- |
Source: Public Records
Mortgage History
| Date | Status | Borrower | Loan Amount |
|---|---|---|---|
| Open | Olszewski Andrew | $121,000 |
Source: Public Records
Tax History Compared to Growth
Tax History
| Year | Tax Paid | Tax Assessment Tax Assessment Total Assessment is a certain percentage of the fair market value that is determined by local assessors to be the total taxable value of land and additions on the property. | Land | Improvement |
|---|---|---|---|---|
| 2024 | $5,615 | $129,395 | $21,945 | $107,450 |
| 2023 | $6,224 | $108,570 | $18,620 | $89,950 |
| 2022 | $6,205 | $108,570 | $18,620 | $89,950 |
| 2021 | $6,156 | $108,570 | $18,620 | $89,950 |
| 2020 | $6,029 | $95,240 | $16,350 | $78,890 |
| 2019 | $5,852 | $272,100 | $46,700 | $225,400 |
| 2018 | $5,311 | $95,240 | $16,350 | $78,890 |
| 2017 | $5,787 | $95,980 | $13,340 | $82,640 |
| 2016 | $5,740 | $95,980 | $13,340 | $82,640 |
| 2015 | $5,820 | $95,980 | $13,340 | $82,640 |
| 2014 | $5,820 | $95,970 | $12,950 | $83,020 |
Source: Public Records
Map
Nearby Homes
- 19890 Idlewood Trail
- 10986 Fawn Meadow Ln
- 20050 Idlewood Trail
- 19997 Idlewood Trail
- 11179 Fawn Meadow Ln
- 20424 Scotch Pine Way
- 19240 Briarwood Ln
- 9401 Pheasant Run Place
- 11432 Pearl Rd
- 20684 Albion Rd
- 11499 Pearl Rd Unit A106
- 10839 Prospect Rd
- 21176 Hickory Branch Trail
- 12385 Corinth Ct
- 21355 Hickory Branch Trail
- 12647 Edgepark Cir
- 12539 Olympus Way
- 18433 Whitney Rd
- 12694 Ionia Ct
- 10353 Oak Branch Trail
- 19722 Tanbark Ln
- 19790 Tanbark Ln
- 19759 Tanbark Ln
- 19686 Tanbark Ln
- 19822 Tanbark Ln
- 19655 Tanback Ln
- 19723 Tanbark Ln
- 19791 Tanbark Ln
- 19691 Tanbark Ln
- 19797 Tanbark Ln
- 19800 Tanbark Ln
- 19790 Albion Rd
- 19655 Tanbark Ln
- 19722 Albion Rd
- 19618 Tanbark Ln
- 10532 Hickory Place
- 19615 Tanbark Ln
- 19690 Albion Rd
- 19586 Tanbark Ln
- 19819 Albion Rd