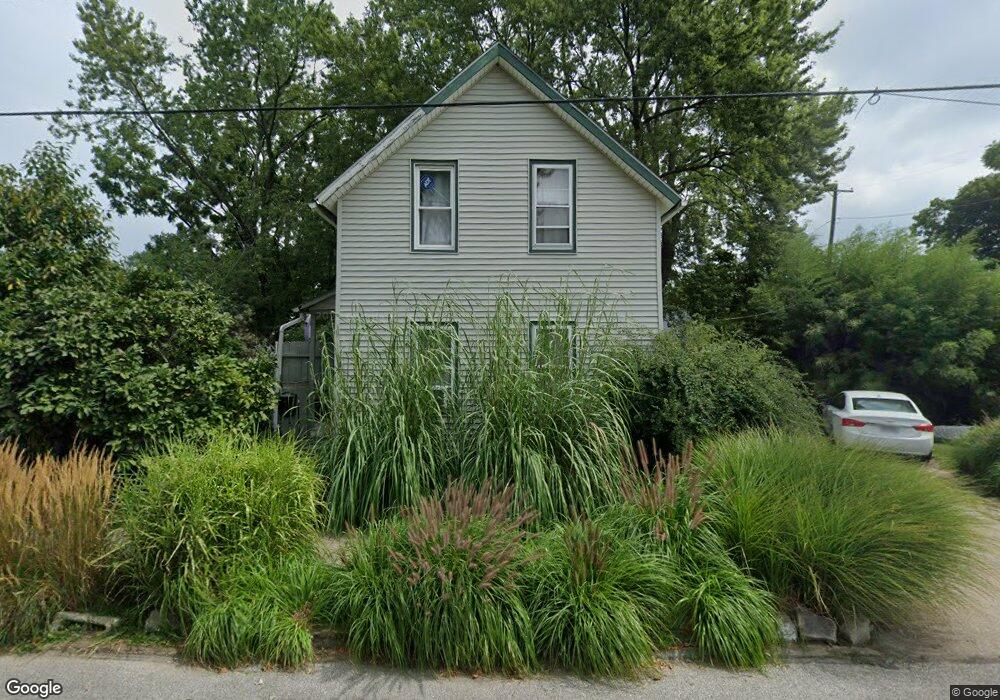
1977 W 57th St Cleveland, OH 44102
Detroit Shoreway NeighborhoodEstimated Value: $137,771 - $225,000
4
Beds
1
Bath
1,156
Sq Ft
$161/Sq Ft
Est. Value
About This Home
This home is located at 1977 W 57th St, Cleveland, OH 44102 and is currently estimated at $186,443, approximately $161 per square foot. 1977 W 57th St is a home located in Cuyahoga County with nearby schools including Almira Academy, Anton Grdina School, and Benjamin Franklin.
Ownership History
Date
Name
Owned For
Owner Type
Purchase Details
Closed on
Jun 25, 1999
Sold by
Niederest David B
Bought by
Brown John D
Current Estimated Value
Home Financials for this Owner
Home Financials are based on the most recent Mortgage that was taken out on this home.
Original Mortgage
$40,150
Outstanding Balance
$10,883
Interest Rate
7.15%
Mortgage Type
FHA
Estimated Equity
$175,561
Purchase Details
Closed on
Mar 29, 1996
Sold by
City Loan Financial Serv
Bought by
Niederst David B and Cotton John E
Purchase Details
Closed on
Feb 12, 1996
Sold by
Sheriff Of Cuyahoga Coun
Bought by
City Loan Financial Services
Purchase Details
Closed on
May 7, 1992
Sold by
Brownlee Carol
Bought by
Hare Charles E
Purchase Details
Closed on
Jun 24, 1988
Sold by
Hegedus Lilla
Bought by
Brownlee Carol
Purchase Details
Closed on
Aug 31, 1982
Sold by
Hegedus Istvan S and Hegedus Lilla
Bought by
Hegedus Lilla
Purchase Details
Closed on
Jan 1, 1975
Bought by
Hegedus Istvan S and Hegedus Lilla
Create a Home Valuation Report for This Property
The Home Valuation Report is an in-depth analysis detailing your home's value as well as a comparison with similar homes in the area
Home Values in the Area
Average Home Value in this Area
Purchase History
| Date | Buyer | Sale Price | Title Company |
|---|---|---|---|
| Brown John D | $39,800 | -- | |
| Niederst David B | $11,000 | -- | |
| City Loan Financial Services | $16,667 | -- | |
| Hare Charles E | -- | -- | |
| Brownlee Carol | $6,000 | -- | |
| Hegedus Lilla | -- | -- | |
| Hegedus Istvan S | -- | -- |
Source: Public Records
Mortgage History
| Date | Status | Borrower | Loan Amount |
|---|---|---|---|
| Open | Brown John D | $40,150 |
Source: Public Records
Tax History Compared to Growth
Tax History
| Year | Tax Paid | Tax Assessment Tax Assessment Total Assessment is a certain percentage of the fair market value that is determined by local assessors to be the total taxable value of land and additions on the property. | Land | Improvement |
|---|---|---|---|---|
| 2024 | $2,689 | $40,215 | $12,670 | $27,545 |
| 2023 | $2,022 | $26,080 | $11,690 | $14,390 |
| 2022 | $2,010 | $26,080 | $11,690 | $14,390 |
| 2021 | $1,992 | $26,080 | $11,690 | $14,390 |
| 2020 | $1,815 | $20,550 | $9,210 | $11,340 |
| 2019 | $1,681 | $58,700 | $26,300 | $32,400 |
| 2018 | $1,291 | $20,550 | $9,210 | $11,340 |
| 2017 | $936 | $11,070 | $5,640 | $5,430 |
| 2016 | $906 | $11,070 | $5,640 | $5,430 |
| 2015 | $745 | $11,070 | $5,640 | $5,430 |
| 2014 | $745 | $9,070 | $4,620 | $4,450 |
Source: Public Records
Map
Nearby Homes
- 2013 W 58th St
- 5408 Ithaca Ct
- 2001 W 58th St
- 1983 W 58th St
- 5816 Madison Ave
- 1939 W 54th St
- 1871 W 57th St
- 1872 W 57th St
- 4809 Fenwick Ave
- 6210 Pear Ave
- 6006 Fir Ave
- 5714 Bridge Ave
- 1828 W 57th St
- 1854 W 58th St
- 4620 Lorain Ave
- 1962 W 47th St
- 1989 W 47th St
- 6209 Bridge Ave
- 1864 W 50th St
- 6707 Colgate Ave
- 1975 W 57th St
- 1978 W 57th St
- 1988 W 54th St
- 1988 W 54th St
- 1984 W 57th St
- 1972 W 57th St
- 5600 Lorain Ave
- 1968 W 57th St Unit 4
- 5508 Lorain Ave
- 1986 W 54th St
- 1986 W 54th St Unit 1/DN
- 1986 W 54th St Unit 2/UP
- 5516 Lorain Ave
- 1982 W 54th St
- 1959 W 57th St
- 1964 W 57th St
- 2015 W 58th St
- 2017 W 58th St
- 2019 W 58th St
- 2021 W 58th St