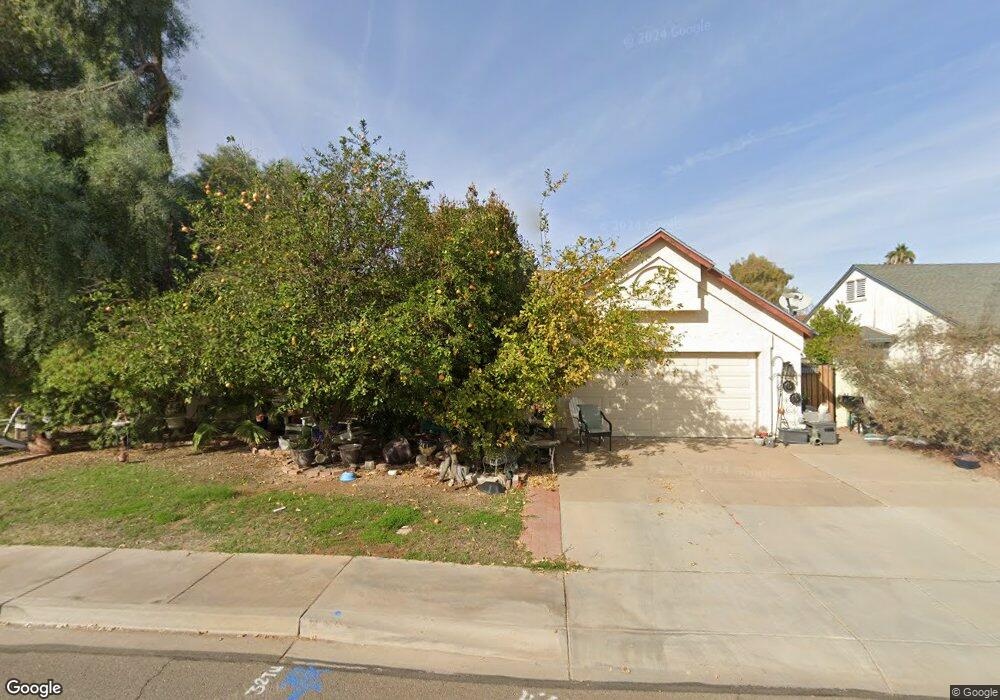
198 S Hazelton Dr Chandler, AZ 85226
West Chandler NeighborhoodEstimated Value: $449,440 - $525,000
--
Bed
2
Baths
1,795
Sq Ft
$275/Sq Ft
Est. Value
About This Home
This home is located at 198 S Hazelton Dr, Chandler, AZ 85226 and is currently estimated at $494,110, approximately $275 per square foot. 198 S Hazelton Dr is a home located in Maricopa County with nearby schools including Kyrene Traditional Academy, Kyrene Aprende Middle School, and Corona Del Sol High School.
Ownership History
Date
Name
Owned For
Owner Type
Purchase Details
Closed on
Oct 4, 2006
Sold by
Brown Valerie
Bought by
Slicocks Marlene
Current Estimated Value
Home Financials for this Owner
Home Financials are based on the most recent Mortgage that was taken out on this home.
Original Mortgage
$289,750
Outstanding Balance
$210,469
Interest Rate
10.85%
Mortgage Type
Purchase Money Mortgage
Estimated Equity
$283,641
Purchase Details
Closed on
Mar 22, 2005
Sold by
Reininga Charles
Bought by
Brown Valerie
Purchase Details
Closed on
Dec 4, 1998
Sold by
Reininga Charles
Bought by
Reininga Charles and Brown Valerie
Purchase Details
Closed on
Oct 24, 1997
Sold by
Brown Valerie S
Bought by
Reininga Charles
Home Financials for this Owner
Home Financials are based on the most recent Mortgage that was taken out on this home.
Original Mortgage
$114,723
Interest Rate
7.36%
Mortgage Type
New Conventional
Create a Home Valuation Report for This Property
The Home Valuation Report is an in-depth analysis detailing your home's value as well as a comparison with similar homes in the area
Home Values in the Area
Average Home Value in this Area
Purchase History
| Date | Buyer | Sale Price | Title Company |
|---|---|---|---|
| Slicocks Marlene | $305,000 | North American Title Co | |
| Brown Valerie | -- | -- | |
| Reininga Charles | -- | -- | |
| Reininga Charles | $116,800 | North American Title Agency | |
| Brown Valerie S | $102,500 | North American Title Agency |
Source: Public Records
Mortgage History
| Date | Status | Borrower | Loan Amount |
|---|---|---|---|
| Open | Slicocks Marlene | $289,750 | |
| Previous Owner | Reininga Charles | $114,723 |
Source: Public Records
Tax History Compared to Growth
Tax History
| Year | Tax Paid | Tax Assessment Tax Assessment Total Assessment is a certain percentage of the fair market value that is determined by local assessors to be the total taxable value of land and additions on the property. | Land | Improvement |
|---|---|---|---|---|
| 2025 | $2,199 | $23,085 | -- | -- |
| 2024 | $2,105 | $21,985 | -- | -- |
| 2023 | $2,105 | $37,050 | $7,410 | $29,640 |
| 2022 | $2,016 | $27,810 | $5,560 | $22,250 |
| 2021 | $2,083 | $25,280 | $5,050 | $20,230 |
| 2020 | $2,039 | $23,630 | $4,720 | $18,910 |
| 2019 | $1,983 | $21,850 | $4,370 | $17,480 |
| 2018 | $1,924 | $19,920 | $3,980 | $15,940 |
| 2017 | $1,842 | $18,220 | $3,640 | $14,580 |
| 2016 | $1,867 | $17,070 | $3,410 | $13,660 |
| 2015 | $1,720 | $16,100 | $3,220 | $12,880 |
Source: Public Records
Map
Nearby Homes
- 3987 W Calle Segunda
- 3808 W Whitten St
- 3841 W Elgin St
- 3522 W Detroit St
- 3608 W Fairview Ln
- 3641 W Saragosa St
- 3513 W Carla Vista Dr
- 3605 W Pecos Rd
- 3427 W Peppertree Ln
- 527 N Pepperwood Ct Unit 3
- 390 N Enterprise Place Unit A6
- 3930 W Monterey St Unit 108
- 3263 W Monterey St
- 4612 W Jupiter Way
- 4611 W Butler Dr
- 4613 W Chicago St Unit 2
- 4554 W Detroit St
- 3833 W Ivanhoe St
- 4624 W Chicago St
- 4628 W Buffalo St
- 190 S Hazelton Dr
- 230 S Hazelton Dr
- 182 S Hazelton Dr
- 3658 W Butler St Unit 2
- 197 S Criss St
- 193 S Criss St
- 209 S Hazelton Dr
- 3595 W Boston St
- 187 S Criss St
- 170 S Hazelton Dr
- 242 S Hazelton Dr
- 3651 W Butler St
- 181 S Criss St
- 217 S Criss St
- 3634 W Butler St
- 169 S Criss St Unit 1
- 227 S Criss St
- 3641 W Butler St
- 161 S Criss St Unit 1
- 158 S Hazelton Dr